Infographics
Have you seen me: 1.3 billion tons of food lost every year
Each year, about 1.3 billion tons of food worldwide is lost or wasted from farmers’ fields to consumers’ plates. Check ...
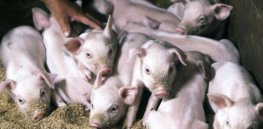
Talking Biotech: Roslin Institute’s Bruce Whitelaw using gene editing to develop virus resistant pig
Roslin Institute animal biotechnologist Bruce Whitelaw is genetically engineering pigs to resist the deadly African swine fever virus ...
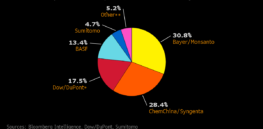
Chart: Bayer AG proposed takeover of Monsanto could create three crop-chemicals giants
With Monsanto Co. acknowledging it has received an unsolicited takeover bid from Bayer AG, the farm-chemicals business is poised for ...
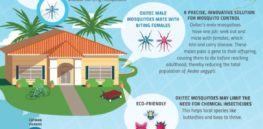
How GMO mosquitos work
Ever wonder how GMO mosquitos work in fight against vector-borne diseases like the Zika virus? Check out this infographic about ...

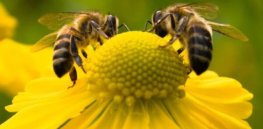
‘Beepocalypse’? How US honey bee population is fairing
There has been an ongoing vigorous debate about the health of the American bee population. Bees play a key role ...
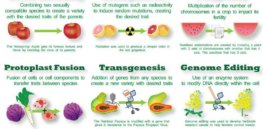
Unnatural natural history of some favorite green veggies
Broccoli, kale, cabbage and others are not naturally occurring plants. They were all engineered by humans who selected for optimal ...

Scientific consensus: GMOs pose no health risks but full potential not yet realized
The GLP aggregated and excerpted this blog/article to reflect the diversity of news, opinion and analysis. There’s. . . a ...


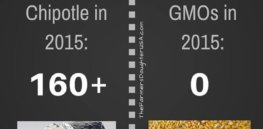
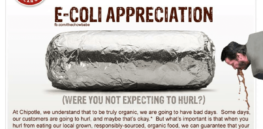
Infographic: Chipotle v GMOs food poisoning scorecard 2015
As the Chipotle food poisoning saga continues to spread across the country, here's a thought to ponder about: ...
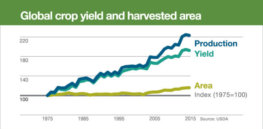
Infographic: Increased crop yield without using more land
We will need more food. Depending on who you ask, it could be anywhere from 30 percent to 70 percent ...

Infographic: Household spending percentage for food
Today, there are more than 7 billion people on the planet. And although undernourishment remains an issue for about 11 ...
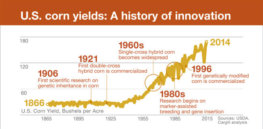
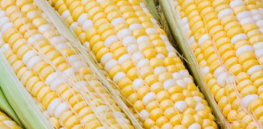
Infographic: Innovation in corn crops to feed hungry world
For decades, U.S. corn yields languished at about 20-30 bushels per acre. But over time, regular investment in scientific research ...
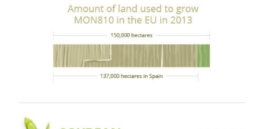
Infographic: GMOs in the EU
The GLP aggregated and excerpted this blog/article to reflect the diversity of news, opinion and analysis. Only one GMO has ...
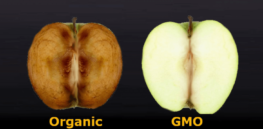
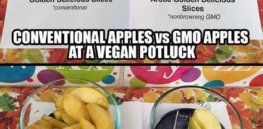
Big Organic Strikes Again: How to spot the dreaded GMO apple
And now you know. And on this Veteran's Day 2015, we say it like GI Joe... "Knowing is half the ...
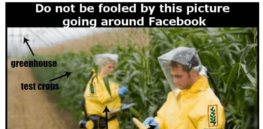
IMAGE: If GMOs are safe, then why are they wearing Hazmat suits?!?
Note for this who don't get it: This is a satire of MonSATAN at work by a pro science group who ...

Anti-GMO ‘Big Lie’: Is labeling really about our “Right to Know”?
Anti-GMO leaders often claim they are not against crop biotechnology; their only desire is a 'right to know' what's in ...
Glyphosate cleared as danger to honey bees
The GLP aggregated and excerpted this blog/article to reflect the diversity of news, opinion and analysis. In September, researchers from ...

How to distinguish a GMO hard-boiled egg from an organic one
This, is a Public Service Announcement from the good folks at Big Organic. Protect yourselves.... For the full explanation of ...