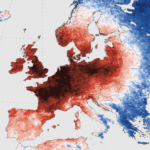


The map [below] shows what the borders of Europe, the Middle East and North Africa might look like if they were based on the dominant Y-DNA haplogroup rather than ethnicity and/or any other political considerations. [Y DNA group haplogroups show only the male lineage, not the female mitochondria line. Another visual representation of male and female haplogroups is available here.]
Here is some very basic information about each group:
Haplogroup R1b: “It is the most frequently occurring paternal lineage in Western Europe, as well as some parts of Russia.”
Haplogroup R1a: “It is distributed in a large region in Eurasia.”
Haplogroup N: “It has a wide geographic distribution throughout northern Eurasia.”
Haplogroup I1: “The haplogroup reaches its peak frequencies in Sweden […] and western Finland.”
Haplogroup I2: “The haplogroup reaches its maximum frequency in the Dinaric Alps in the Balkans.”
Haplogroup J1: “This haplogroup is found today in significant frequencies in many areas in or near the Middle East.”
Haplogroup J2: “It is found in Western Asia, Central Asia, South Asia, Europe and North Africa.”
Haplogroup E: “Most members of haplogroup E-M96 [..] are found almost exclusively in Africa.”
Haplogroup G: “At the level of national populations, G-M201 is most commonly found in Georgia.”

The GLP aggregated and excerpted this blog/article to reflect the diversity of news, opinion, and analysis. Read full, original post: If European Borders Were Drawn By DNA Instead Of Ethnicity