

The purpose of the following section is to explore commodity to commodity differences by a variety of measures and not to rank them for safety as such. Each crop has its own unique challenges in terms of pest management. They also differ in terms of residue potential (e.g. items that are peeled vs those that are not. Those that are harvested in a single picking vs multiple pickings…). The data in this section is presented using the same seven category graph and six statistic summary format used earlier for all samples (Figure 1).
[su_panel color=”#3A3A3A” border=”1px solid #3A3A3A” radius=”2″ text_align=”left”]This is the final part of a two-part series.
Read part one: Challenging Environmental Working Group’s Dirty Dozen scare survey of pesticide residues on conventional fruits and vegetables [/su_panel]
Apple juice
Apple Juice stands out among the 2020 commodities in that 100% of the detections are below EPA-defined tolerances and 98.2% could have met the “Organic 5% Rule.” 75% of detections were in the three categories below tolerance by 100 times or more. Since this juice is widely consumed by children this is an excellent example of how the Food Quality Protection Act goals are being met.

Bananas
Bananas are another example of a “child-friendly” commodity with a 100% EPA compliant detection profile at relatively few average detections/sample (Figure 4). In this case, the most dominant category of residue detections are in the range of 20 to 100 times lower than tolerance with 31% in the lowest three relative detection categories. In banana production regions one of the biggest challenges is a fungal disease called Black Sigatoka. It does not infect the fruit, but if there is too much infection of the leaves as the fruit is growing it will not survive the low carbon footprint ocean shipping process. This is a good example of a case where growers are using fungicides to control the disease any yet doing so in such a way that keeps residues at safe levels – even 91.5% at levels that could meet the “Organic 5% Rule.”

Blueberries
The USDA had some difficulty collecting typical market-representative blueberries in 2020 because of COVID19 pandemic issues. Only 168 fresh samples were tested and only 6 frozen. 97.2% of the detections among fresh samples were below tolerance and 81.2% could have met the organic 5% rule. 48% of detections were in the three lowest relative detection levels below tolerance by 100 times or more.
There were 15 detections with no tolerance, but 13 of those were below the lowest tolerances for that chemical on other commodities. The other two were low level detections – 0.004ppm for 3-hydroxycarbofuran and 0.059ppm for cyphenothrin. None of these blueberry no-tolerance detections was over 0.1 parts per million. There was a single detection of cyhalothrin at 2.7 times tolerance which is of no real concern.

Broccoli
There were no chemicals detected at above tolerance levels among the 2020 broccoli samples and the most frequent category of detections were 500 to 2,500 times lower than tolerance helping to drive the “<1% of tolerance” statistic to 78.5% (Figure 6). This is another very clean example with an average detection/sample rate of 1.97 and with 96% of detections meeting the EPA standard and 91% that could have been given the organic 5% exemption. There were 55 “no tolerance” detections – the second highest count among 2020 commodities, but 51 of those were below low tolerances for other crops. There was one no-tolerance detection of thiobencarb at 0.03ppm, one of pirimiphos methyl at 0.008ppm, and one of etoxazole at 0.0017ppm which was annotated as QV meaning that it was at the margin of detection and quantification. One residue of pyrimethanil at 0.6ppm exceeded a tolerance for Bananas at 0.1ppm but it was below tolerances of 3 and 15 for other crops.

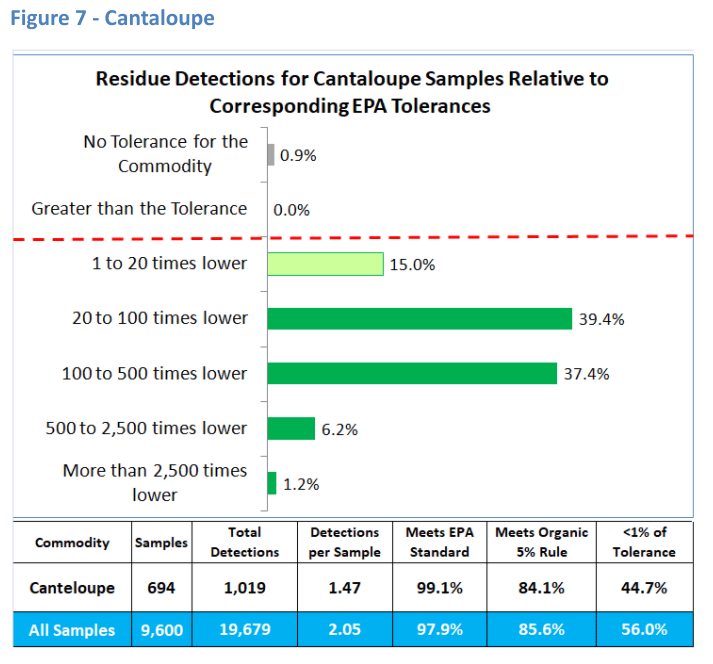
Cantaloupe
Cantaloupe was another 2020 commodity with no detections of above tolerance residues. The average number of detection/sample was lower than average at 1.47. 99.1% of detections met the EPA standard, 84.1% could have met the organic 5% rule and 44.7% were in the three lowest relative detection categories. There were 9 (0.9%) “no-tolerance” detections. 12 of those 15 detections were below low tolerances for other commodities and the other 3 were at very low levels (Mirex at 0.0017, 0.002 and 0.0022ppm).
Carrots
Carrots had a lower number of detections per sample than the all-commodity average (1.2 vs 2.1) but most (55%) were in the 20 to 100 times lower than tolerance category. Still, 94.9% were fully compliant with the EPA standard and 79.2% could have met the organic 5% rule. Only 24.2% were in the lowest three relative detection categories. Of the 22 “no-tolerance” detections, 20 were below low tolerances for other commodities and the remaining two were for PCB at 0.005 and 0.0051ppm.

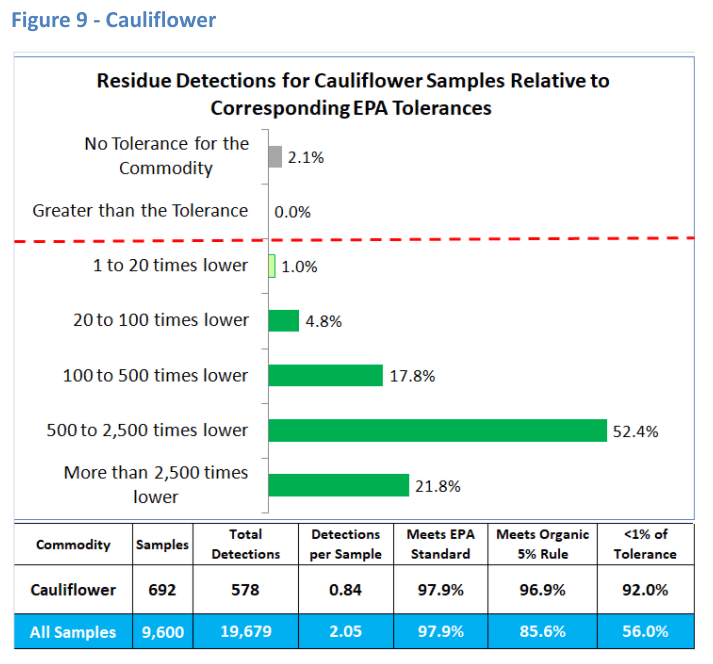
Cauliflower
Cauliflower stands out for having numerous desirable statistics. On average there was less than 1 detection per sample, 97.9% met the EPA standard and 96.9% could have met the organic 5% rule. Fully 92% of the detections were in the lowest three relative to tolerance categories with the 500 to 2500 times lower category being the largest at 52.4%. There were no greater than tolerance detections for 2020 cauliflower samples. Of the 12 “no-tolerance” detections, 10 were below low tolerances on other crops and the other two were very low level (thiobencarb 0.0017 and 0.009ppm).
Collard greens
Collard Greens have only been tested twice as part of the PDP with a small sample set (187) in 2019 and a larger set (514) in 2020. Overall, the results for this commodity were positive in that 95% of detections met EPA standards, 88% could have met the organic 5% rule, and 68% were in the very low relative detection categories below 1% of tolerance.
There were more detections with “issues” for collard greens than for most other commodities in 2020. There were 4.1 detections/sample which matches the number for Green Beans as the highest for the year. The commodity had 85 “No-Tolerance” detections (4%) which is more than any other commodity. Seven such detections were over 0.1ppm, however; only 2 of those (propargite at 0.09ppm and chlorothalonil at 7.7ppm) slightly exceeded tolerances for other commodities, and one was for a chemical with no recent tolerances for comparison (bromacil at 0.0044ppm). There were 20 “greater than tolerance” detections for collard greens (0.9%) but only six residues were more than 5 times tolerance (see Table 4).

Eggplant
Overall eggplant results for the 2020 PDP are similar to the multi-commodity averages (98.4% meeting EPA standards, 79.3% meeting the Organic 5% rule, average of 2.17 detections/sample (Figure 11). The most frequent detections were in the 100 to 500 times lower than tolerance range with 52.1% in the three <1% of tolerance categories. Twenty of the 21 “No tolerance” detections for the commodity were below low tolerances for other crops with only one exceeding any such tolerances (Fipronil at 2 times a tolerance for potato). There were three slightly greater than tolerance detections among eggplant samples (bifenthrin 1.2x and 1.6x and acephate 5x).

Green beans
90.1% of Green Beans detections for 2020 met the EPA standard. There were 3.04 detections per sample which is higher than average across commodities. They also had more of the “1-20 times lower than tolerance” detections that would not have qualified under the organic 5% exemption rule. Even so, 42% of detections were more than 100 times lower than tolerance. Green beans had relatively more no-tolerance and greater-than-tolerance detections than average in the 2020 PDP (5.8% and 4.1% respectively). The no-tolerance detections were all below 0.1ppm and were mostly below tolerances on other crops (24 of 31).There were no reference tolerances for four detections of Isoprothiolane between 0.0013 and 0.0016ppm, fipronil sulfone at 0.009ppm and profenofos at 0.003ppm. One detection of fipronil at 0.06ppm is two times a tolerance for potatoes of 0.03ppb.
The “greater than tolerance” detections for green beans included four different chemicals: acephate (6), buprofezin (1), dinotefuran (8) and methamidophos (6). Among those detections there were several that were somewhat problematic: acephate at 31, 225 and 340 times tolerance; and methamidophos at 10, 55 and 55 times tolerance. The acephate at 31x tolerance was for an organic sample from Mexico. Because green beans mature on the plant fully exposed and because they are not peeled, it is not surprising that there would be more and potentially higher residues. Even so, this food option isn’t something to avoid.

Kiwis
Kiwis had no above tolerance detections and the lowest average number of chemical detections per sample (0.33), but the residues that were detected were mostly in the range of 1 to 20 times lower than tolerance. This may be because the USDA scientists did not peel the kiwis before testing because apparently there are consumers who eat them that way. With the rough surface left it is logical that some more residues would persist during washing. This makes it even more encouraging that none of the detections were greater than tolerance. There were only four “no tolerance” detections but those residues were all below the lowest tolerances on other commodities. Overall, Kiwis are a very safe component of the food supply.

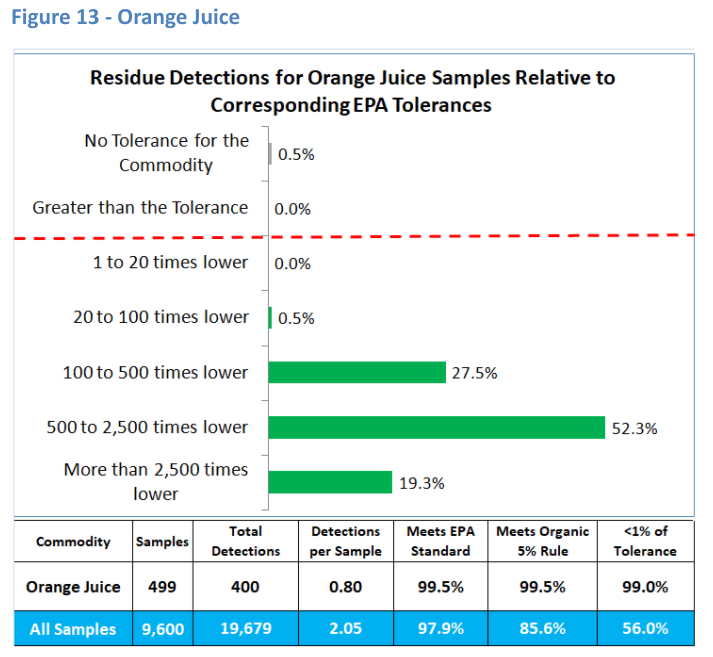
Orange juice
Orange juice samples for 2020 had an outstandingly low pesticide residue profile with 99.5% meeting both the EPA standard and the organic 5% rule threshold. In fact,99% of detections were more than 100 times lower than at less the EPA tolerance! None were greater than tolerance. Only 2 detections were “no-tolerance” examples, and those were below tolerances for other crops. The profiles were very similar for the domestic and imported sample.
Radishes
Radishes are another example of a commodity for which there were relatively few detections per sample but at levels closer to the tolerance than seen with other commodities. Even so, 97.5% of the detections met the EPA standard and 71% could have met the organic 5% rule. There were 9 detections without a tolerance, but 8 were below tolerances for other crops while one exceeded that threshold (pyrimethanil 1.2 x a tolerance for Bananas – many higher tolerances for other commodities). There were 5 detections (0.9%) that exceeded the radish tolerance – all to a relatively small degree (Fluopicolide at 1.4x, 1.4x, 1.9x, thiamethoxam at 1.7x and cyhalothrin at 1.4x). None of the issues for this assessment of radishes is problematic.

Summer squash
2020 Summer Squash samples were 99% compliant with EPA tolerances with no residues exceeding tolerance and only 5 “no-tolerance” residues all of which were below tolerances for other commodities. This is another outstanding record. 77% of the detections could have met the organic 5% Rule. The proportion of very low relative detections is smaller for this commodity (34.9%), but that in no way detracts from the positive overall nature of these results.

Sweet Bell Peppers
Sweet bell peppers had a somewhat higher number of detections per sample (4.07) but were still 99.3% in compliance with EPA tolerances. The dominant category of detections was in the range of 20 to 100 times lower than tolerance with only 29.5% in the lowest three categories. There were 9 “no-tolerance” detections, 7 of which were below tolerances for other commodities and 2 with no other reference tolerances were at very low concentrations (etradiazole at 0.006 and 0.008 ppm). There were 10 detections above tolerance, but only one was more than 2x higher – cyhalothrin at 4.85x tolerance from the Dominican Republic. In fact, 8 of the 10 greater than tolerances were with imported samples (Mexico, Honduras, El Salvador and the Dominican Republic). Overall, this is another commodity that can be enjoyed without safety concerns.

Tangerines
Tangerines in 2020 had extraordinarily low-level residue detections relative to tolerances with 95.4% being less than 1% of the tolerance. 99.5% met the EPA standards and 99% could have qualified under the organic 5% rule. There were seven “no-tolerance” detections 5 of which are below tolerances for other commodities. The other two were simazine at 0.0061ppm and Isopyrazam at 0.0055ppm. Interestingly 4 of the NT detections were on imports from Morocco. There were only two detections above tolerance and that only by a factor of 4.3 for formetanate hydrochloride. These extremely low detections are at least partially attributable to the fact that Tangerines are peeled, but since they are popular with children that is a particularly good characteristic.

Tomato paste
Tomato paste had an average of 3.91 detections per sample, but 99.7% and none were above tolerance. There were 6 (0.3%) low concentration “no-tolerance” detections below tolerances for other commodities. Interestingly 2 of those detections were for organic samples. 91.7% of the detections could have met the organic 5% Rule and 65.5% were in the lowest three relative detection classes below 1% of tolerance.

Winter Squash
97.3% of winter squash 2020 detections were below tolerance and 82.3% could have met the Organic 5% Rule. The largest category of detections were 20 to 100 times lower than tolerance and 39.4% were in the three lowest relative categories. There were 41 no-tolerance detections (2.6%); however, all but three were well below tolerances for other commodities. Those were benalaxyl at 0.0096 and .0086ppm and pentachlorobenzene (PCB) at 0.002 ppm. There was one above tolerance detection of the insecticide acephate at 2.6x tolerance and dieldrin at 1.1x tolerance.

Comparison based on the average number of detections per sample
In the “Dirty Dozen” narrative from EWG, all of these detections are treated as evidence of “harmful pesticides”. There is a focus on the number of detections per sample without regard to how they compare with the tolerance. Thus, for instance, a residue that is more than 100 times lower than tolerance is treated as if it is a health concern issue.
A more appropriate way to consider the number of detections per sample is to compare that statistic with the percentage of <1% of tolerance detections. See Figure 19.

This graph can be divided into four “zones” for comparisons between two statistics – the percent of detections that are more than 100 times lower than tolerance on the x axis, and the average number of detections per sample on the y axis. The average result for all commodities is labeled in red and each commodity is labeled with an abbreviation (key above).
Overall, there was no real relationship between these two variables. Some commodities with fewer detections/sample also had almost all very low-level residues compared with tolerances (especially cauliflower and orange Juice). But other crops with below per-sample detection rates did not have nearly as many of the very low categories relative to tolerance (e.g. kiwis, carrots, radishes, and bananas). The commodities with more detections per sample were divided between those with few and those with many very low-level detections. A “clean vs dirty” ranking does not it for this analysis, particularly since almost none of the detections were problematic.
Detections for organic samples
Even though the PDP data for 2020 once again documented the safety of the commodities it analyzed, the EWG will produce yet another “Dirty Dozen List” that supposedly references those results. What this does is to reinforce the prominent myth that organic farming means “no pesticides” and thus no pesticide residues. Those claims are simply not true.
Organic growers must deal with pests and they are allowed to use pesticides that can be classified as natural. The US Department of Agriculture posts its approved list online with an explanation here. Although most people believe organic farmers use no synthetic chemicals, that’s not true, the National Organic Standards Board uses non-organic substances when an organic substance “isn’t available in organic form on a scale large enough to support organic agriculture.
Consumers who rely on EWG’s Dirty Dozen almost always assume that organic products contain fewer or no pesticides, and that when natural pesticides are used, they are less toxic. That is not true. Organic does not necessarily equate with low toxicity or carcinogenicity. Approved chemicals for organic, which like synthetic products are regulated by the EPA, include copper-based fungicides, petroleum distillates, sulfur, plant extracts, and fermentation product. The fact that they can be considered natural is not an automatic safety standard.
Many natural products exhibit low toxicity and are used by conventional as well as organic growers. However, some of the key products on which organic farmers depend require higher use rates and are relatively toxic by modern standards. An example is copper sulfate which is fairly toxic, accumulates in soil and is deleterious to beneficial insects (in fact, European farmers generally use more highly-toxic chemicals per acre than US farmers because of their reliance on copper-based fungicides to support the vast wine industry)
Almost none of the natural product-based pesticides are measured as part of the PDP. This is because they cannot be evaluated using the efficient analytical technologies that can identify and quantify hundreds of different synthetic molecules. As a result, EWG ignores them in their ratings, which presents a misleadingly positive snapshot of organic foods.
It’s known that some farms that sell organic foods sidestep the restrictions on chemicals, but the magnitude of the fraud is not known. According to Miles McEvoy, former deputy administrator of the National Organic Program,“organic is not a zero-pesticide label or claim, something consumers often don’t understand.” In 2012, a USDA study revealed that 39 percent of 571 samples of domestic and imported organic produce contained pesticides.
It is also widely documented that many imported organic foods contain banned synthetic chemicals or are otherwise not organic. While most food sold as “USDA Organic” is grown in the U.S., at least half of some organic commodities — corn, soybeans and coffee — come from overseas, from as many as 100 countries. The US currently purchase more than $2 billion in organically certified agricultural products annually from around the globe.
Spinosad
The fermentation-based insecticide spinosad is one of the only common natural products that can be tracked by the PDP methods. To measure the others would require expensive, custom methods and the USDA has elected not to divide its resources that way. If the natural products were measured it is likely that there would be detectable residues on both organic and conventional foods, but the levels would probably be as non-consequential from a safety standpoint as those seen for the synthetics.
So, even though the PDP does not test for the pesticides most likely to be used on organic crops, there were 172 detections for organic samples representing 55 different chemical pesticides (see tables 2 and 3 below), only one of which was approved for use on organic crops (spinosad). The average number of detections per sample was substantially lower among organic samples (0.24 vs 2.19 for conventional) and that would be expected since the organic rules do not allow the use of these chemicals. Residues were detected for 107 of the 706 samples with 38 samples having between 2 to 7 detections and 67 having just one.
These sorts of chemicals were identified among organic samples of all commodities, but the largest numbers were for collard greens (42) followed by winter squash (38) and summer squash (15). What is somewhat surprising is that the distribution of detections relative to tolerance is quite similar for organic and conventional, as shown in Figure 20 (conventional results shown in the clear bars for each category).

There were proportionally more “no tolerance” and “greater than tolerance” detections among the organic samples and slightly fewer that could meet the “organic 5% rule.” Since only 7.4% of the samples were claimed as organic these differences are probably not statistically significant. These detections among organic commodities need not raise concern for consumers, but neither should the detections for conventional. However, their presence does not fit the common perception of organic by consumers or the organic brand promotion agenda of the Environmental Working Group.
In sum, what the PDP demonstrates is that it is safe to consume both the conventional and organic options represented in this and other years of analysis.


In addition, among the organic samples there were single detections of acephate, carbaryl, carbendazim (MBC), chlorothalonil, chlorpyrifos, cyhalothrin, DDD o,p’, dimethomorph, endrin, etofenprox, flubendiamide, fluopicolide, heptachlor, Imidacloprid urea, indoxacarb, methamidophos, penthiopyrad, pronamide, propamocarb hydrochloride and trifluralin.
Organic and conventional farmers use pesticides that can be classified as “natural” which is not a safety-based distinction as such, but there is not a process like the PDP to track residues of these products. The synthetic chemicals that are tracked by the PDP can be found on some organic samples, but these detections are at very similar concentrations to what is found in general and the same safety conclusions apply to both conventional and Organic options.
Conclusions
The Pesticide Data Program for 2020 confirms once again the basic conclusion that a diverse collection of fruit and vegetable options are safe to consume from a pesticide residue point of view.
- Analytical technologies used for this program are extremely sensitive and because the data is presented in a transparent fashion those extremely low residue values are published. To describe such detections as hazardous or “dirty” is not only scientifically unjustified, it is irresponsible
- Data documents the fact that our US system of pesticide regulation is working in the sense of defining use label requirements (rates, pre-harvest intervals…) which keep residues low enough at the consumer level so that they do not constitute a health risk
- Data also documents the high level of compliance with regulations by those that grow our food, both domestically and from exporters to the US
- Although the PDP dataset only includes 7.3% organic samples it does provide a window on that category, showing that there were synthetic chemical residues on 15% of the samples. The average number of detections per sample and the percent of samples with residues are understandably lower for organic, but most of the pesticides used intentionally and legally under the USDA organic rules are not evaluated in the PDP process. Interestingly, the distribution of detection levels relative to tolerance for the organic samples is similar to conventionally produced samples.
- Perhaps the most important finding is that consumers should definitely not let unfounded fears about pesticide residues deter them from enjoying the heath promoting produce available in the United States.
Steve Savage is a plant pathologist and senior contributor to the GLP. Follow Steve on Twitter @grapedoc