

The recent release of the “Dirty Dozen List” by the organic-industry-funded Environmental Working Group has stirred up its annual hornets’ nest of social media controversy over the alleged dangers of pesticide residues on conventional fruits and vegetables. Consumers understandably ask: Is this list science-based and reliable?
The answer is an unequivocal ‘no’. EWG rejects evaluation standards set by the US Department of Agriculture and instead offers its own proprietary rating system, which it refuses to transparently reveal—one that does not correspond to any assessment system used by any regulatory body anywhere in the world. Recognizing there is widespread confusion about how to evaluate pesticide hazards, it’s helpful to review how US standards work and what the data actually show.
[su_panel color=”#3A3A3A” border=”1px solid #3A3A3A” radius=”2″ text_align=”left”]This is the first part of a two-part series.
Read part two here: USDA finds almost no pesticide-related health concerns from fruits and vegetables grown on American farms, while data on organic food is lacking[/su_panel]
What is the PDP?
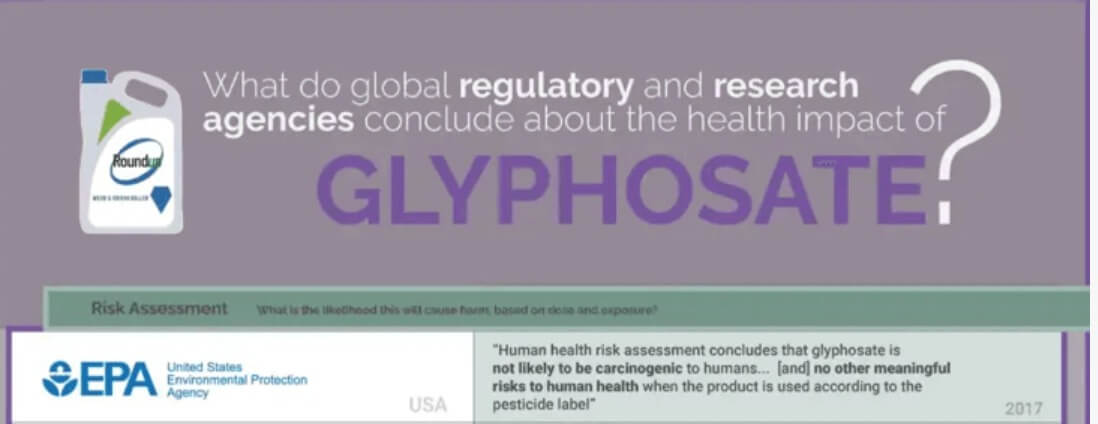
This year marks the 30th anniversary of the USDA Pesticide Data Program. PDP as it’s called is a public data generation and reporting effort focused on assessing pesticide residues in the US food supply. Each year the Federal agency and 9 state agencies work together to sample around 10,000 mostly fruit and vegetable food products representative of the US consumer market. They take the samples to labs and evaluate them for the presence of pesticide residues. That data is then compared with the appropriate safety benchmarks called “tolerances” that have been set by the Environmental Protection Agency (EPA).
Like EWG’s effort, this USDA analysis is essentially a “report card” on how well both domestic and international farmers are doing in terms of their compliance with the detailed rules that the EPA has established in order to protect consumers in terms of pesticide-related health issues. In contrast to EWG’s scare antics, the PDP data is based on science rather than ideology, and it is government funded rather than financed by organic companies with a financial incentive to demonize conventional agriculture and promote organics. It gives consumers the confidence to enjoy the health-promoting fruit and vegetable options available in the US market.
One very positive feature of the PDP, and in contrast to the EWG model, is its transparency. All the details of the sampling and measurement process are described in public documents and on the USDA-PDP website. Both high level and detail summaries are published, but in addition to that, all of the underlying data is available in an on-line database. In recent years, the USDA has provided a powerful search tool that can be used generate any data subset of interest to outside observers.
For each year’s PDP the USDA selects a different group of commodities with the goal of both covering the range of produce options and periodically repeating key categories. For 2020 the list included Apple Juice, Bananas, Blueberries (fresh and a few frozen), Broccoli, Cantaloupe, Carrots, Cauliflower, Collard Greens, Eggplant, Green Beans, Kiwis, Orange Juice, Radishes, Summer Squash, Sweet Bell Peppers, Tangerines, Tomato Paste and Winter Squash.
Unfortunately, this transparency has been exploited by groups which conduct assessments skewed to make the benign and encouraging results seem negative. The most notorious and scientifically flawed is the “Dirty Dozen List”— EWG calls it a “Shopper’s Guide”. It is essentially fear-based marketing for the broader organic industry. It classifies the residues as hazardous even though they are at levels which the global scientific community agrees do not create a health risk.
The only legitimate conclusion from the PDP data is that consumers can safely enjoy these commodities whether they are produced using organic or conventional farming methods. EWG’s disinformation campaign has negative consequences because of the unfounded concerns it promotes which discourage American consumers from eating the amount of fruits and vegetables recommended by health/nutrition experts. EWG receives funding through the Organic Voices Action Fund from several organic brands, including Stonyfield, Earthbound Farm, Organic Valley, Nature’s Path and Annie’s who advertise that their products are healthier than conventional alternatives. Notably, Nature’s Path and Annie’s do not sell produce, which are the products evaluated by EWG. Nor do they necessarily make healthy food; One of Annie’s most popular products, for example, is macaroni and cheese junk food.

The OVAF, which is a one-person run operation that operates as a slush fund to the organic industry, says its mission is to lobby for the mandatory labeling of genetically engineered foods, which it believes would stigmatize conventional foods. That makes it a perfect match with EWG and its notorious ‘dirty list’.
Purpose of this analysis
Even though the summaries of the PDP from the USDA provide abundant information to help review the data and draw logical conclusions, it is the goal of this analysis to take advantage of the PDP data transparency in order to further emphasize the fact that most of the residues not only meet the EPA standard but are far below that relevant safety threshold. This type of summary is also useful when it comes to looking at differences between commodities, the regions in which they are grown, and the claims that are made about them (e.g. organic).
Farmers deal with many challenges in the process of growing the food, feed and fiber on which we all depend. Crop pests are one of the more significant issues they face, and grower’s ability to limit pest damage is critical for the quantity and quality of foods at the consumer level. Pest management is also a key element of sustainability since pest-related yield loss compromises the use-efficiency of water, energy, land and labor. Farmers employ multiple strategies in modern integrated pest management or “IPM” programs including pest resistant lines of the crop, pest exclusion methods, microclimate modification, crop rotation, and the encouragement of beneficial organisms.
However, pesticides are still a key element of the program including synthetic chemicals, natural chemicals, and live biological organisms. Modern pesticides are much different than the problematic historical examples that originally helped drive the establishment of the Environmental Protection Agency (EPA). These crop protection products are generally low in overall toxicity and don’t exhibit the environmental issues of something like DDT. There are also detailed rules (label requirements) that farmers must follow when using these products to further minimize health or environmental impacts.
One of the key goals of the EPA rule-making process for products is to make certain that by the time the food item reaches the consumer, any pesticide residues have diminished to levels well below that which would cause harm. Based on all of the toxicology data about a given product and all that is known about how its concentration declines over time, the EPA sets a “tolerance” level for residues below which there is no health concern for the consumption of that food.
In fact, the tolerance also reflects an additional built-in safety margin of around 100. The PDP program is one of the many pesticide regulatory policies instituted through the passage of the Food Quality Protection Act or FQPA in 1996. Within that framework the USDA was assigned the role of monitoring the food supply for pesticide residues and particularly to consider foods more often consumed by infants and children.
Methodology
For the 9,600 samples tested in the 2020 PDP there were 19,679 residue detections –an average of 2.05 per sample. These are mostly at very low concentrations averaging 0.058 parts per million (58 parts per billion). The median residue concentration was 0.012 parts per million, and 95% of the detections were below 0.21 parts per million. These are tiny values which are only measurable because of sophisticated analytical technologies.
However, the statistic that really matters is how the detections compare with the EPA tolerances. The searchable PDP database provides the relevant commodity/chemical-specific tolerance along with each detection record and those were used to calculate how many times higher or lower the individual detections were relative to tolerance. For example, a detection of 0.1 ppm for a chemical with a 1ppm tolerance is described as “10 times lower than tolerance.” In the rare cases where the detection was higher than tolerance they are classified by how much higher; a detection of 1ppm for a tolerance of 0.5ppm would be “2 times higher than tolerance.”
One way to visualize the distribution of detections relative to tolerance is to sort them into categories as shown in the graph (figure 1) based on all detections from all commodities tested in the 2020 program.

The bars in the graph above (and in subsequent graphs later in this document) represent the following seven subsets of the detections:
- Grey bar is for detections for which there is no assigned tolerance for that crop/chemical combination (“No Tolerance for the Commodity”). For 2020 only 1.7% of all detections fall in this category and a summary of those detections are shown in Table 1 and Figure 2 later in the document. The details are discussed in the individual commodity sections.
- Red bar (0.4% of 2020 detections) is for residues at levels “Greater than the Tolerance.” (See Table 2 and Figure 3 with details in commodity sections).
- Light green bar is for detections that are between the tolerance and 20 times lower than tolerance. The PDP is not part of compliance testing associated with USDA organic certification, but if synthetic pesticide residues are detected in such a process, residues below 5% of tolerance are considered to have been “inadvertent” and thus not a reason to deny certification. This is not a safety standard, but synthetic residues in this “1 to 20 times lower” categorywould not comply with this organic standard while detections below 5% of tolerance could “meet the organic 5% rule.”
The remaining 4 bars (dark green) each cover a range 5 times lower than the previous category and these are employed in order to visualize just how far below tolerance these detections tend to be.
- Detections 20 to 100 times lower than the tolerance
- Detections 100 to 500 times lower than the tolerance
- Detections 500 to 2,500 times lower than the tolerance
- Detections more than 2,500 times lower than the tolerance
There are some detections that are even more than 10,000 times lower than tolerance, but in this range the laboratory methods for some chemical/crop combinations are unable to reliably quantify such tiny quantities. As a rule of thumb for the PDP, detections below 1 part per billion are simply classified as non-detects.
Six additional statistics are listed at the bottom of each graph (by commodity, claim, origin…):
- Number of samples
- Total detections
- Detections per sample on average
- Percent that meets the EPA standard (e.g. below the relevant tolerance – the sum of all five bars below the red dashed line – one light green and four dark green)
- Percent that “Meets the Organic 5% rule” (the sum of last four dark green bars)
- Percent that are “<1% of Tolerance (sum of last three dark green bars)
When looking at the summary of the entire 2020 dataset shown in Figure 1, there is only one logical conclusion: there is nothing “dirty” about these residue profiles. Instead, they are documentation of the fact that farmers are able to use crop protection products to limit pest damage while still providing consumers with safe and healthy diet options.
“No tolerance” and “above tolerance“ detections
There were small subsets of the 2020 detections that were either without a reference tolerance or above a tolerance. There are specific reasons for why most of these are of no real safety concern and that their existence in the PDP databases in no way compromises the overall conclusion that our food supply is safe. However, in keeping with the transparency of the overall PDP program, they do warrant a closer look.
- No tolerance detections
In 2020, 332 (1.7%) of the detections were for chemicals for which there was no corresponding commodity-specific tolerance (See Table 1 below). These were generally very low-level detections consistent with inadvertent presence because of cross contamination from equipment or spray drift. 96% of these residues were at less than 0.1 parts per million and 99% were below 1 part per million. In most cases there were tolerances for these chemicals for other commodities. In Table 1 (below) the No Tolerance detections are sorted by crop. 301 of the detections were lower than the lowest tolerance for other commodities in recent PDP databases. 26 detections were for chemicals without other tolerances for comparison. Only 5 detections exceeded the low tolerance for another crop. These last two categories are discussed in the commodity-specific discussions later in this document.

- Greater than tolerance detections
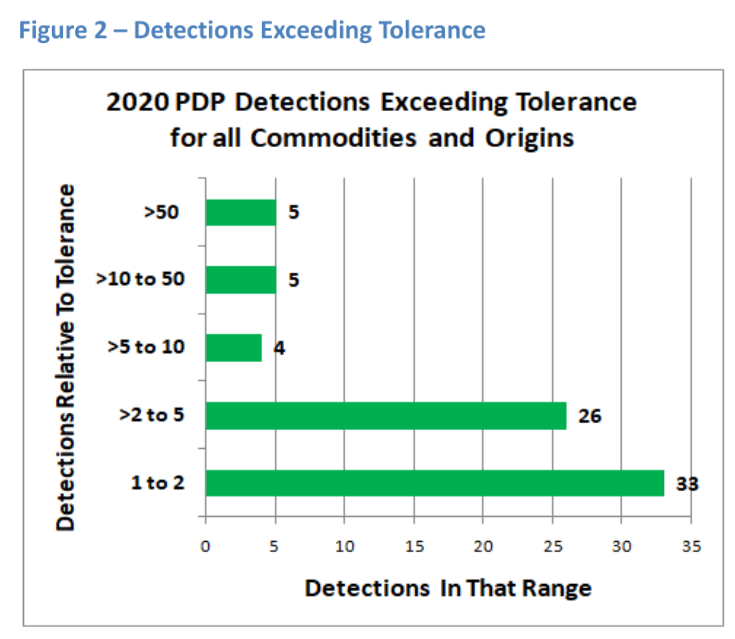
Only 0.4% of all 2020 PDP detections exceeded the reference EPA tolerance. Considering that tolerances incorporate a substantial margin of safety, most of these are of little significance since only 10 of the 73 were more than 10 times tolerance and 59 were less than 5 times tolerance (Figure 2). Details are discussed is a separate section later in this document.
In Part II, we will review 18 fruits, vegetables and juices to see what the USDA found, and whether the fears stirred by the likes of EWG’s Dirty Dozen list are warranted.
Steve Savage is a plant pathologist and senior contributor to the GLP. Follow Steve on Twitter @grapedoc