

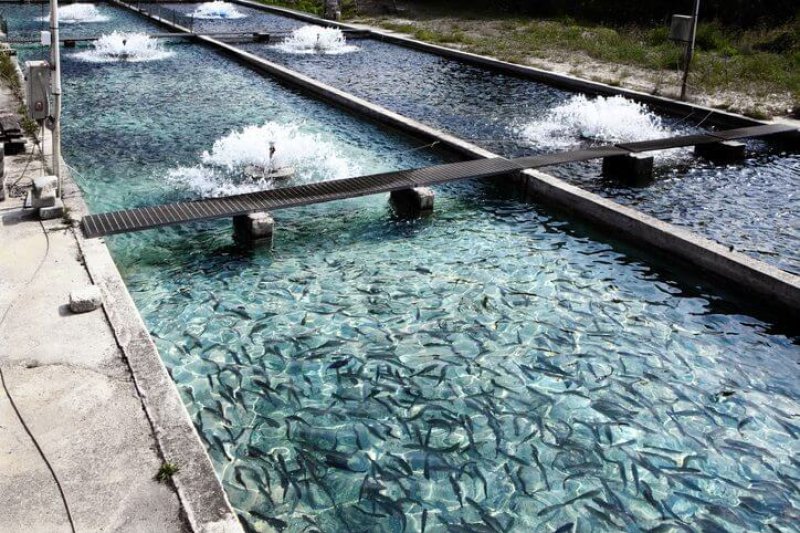
Reliable figures on the carbon footprints of different aquaculture species are hard to find – not least due to the variety of production systems they come from – but all suggest that aquaculture holds its own against other forms of animal protein production.
In simple terms, a food product’s carbon footprint is expressed as the total kg of CO2 (or relative amounts of other greenhouse gases which are converted to CO2 units, based on a comparable global warming impact) released per kg of finished, edible product. This total value involves all activities over the course of production, processing, distribution and waste disposal/degradation (including food waste). All of these phases taken together are referred to as the product life cycle.
For example, according to the SU-EATABLE LIFE database of carbon and water footprints, sunflower oil has a carbon footprint of only 0.98 kg while that of olive oil is 3.27 kg. Similarly, the database indicates milk from cows has a value of 1.31 kg, while buffalo milk is estimated at 3.57 kg.
Carbon footprint values ranging from 4 kg to 540 kg have been reported for wild seafood products (per kg protein), compared to a range of 4 to 75 for aquaculture (also per kg protein).