Infographic: Trump-voting Republican counties suffered more than twice the death rate from COVID than Democratic ones

Credit: Getty Images/Kaiser Health News

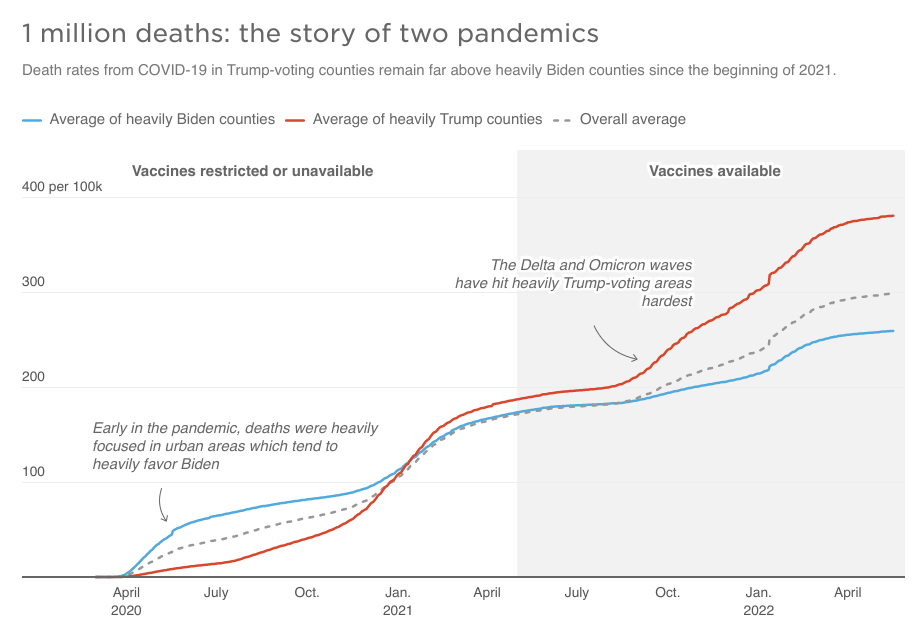
Even with widely available vaccines and newly effective treatments, residents of counties that went heavily for Donald Trump in the last presidential election are more than twice as likely to die from COVID-19 than those that live in areas that went for President Biden. That’s according to a newly-updated analysis from NPR, examining how partisanship and misinformation are shaping the pandemic.

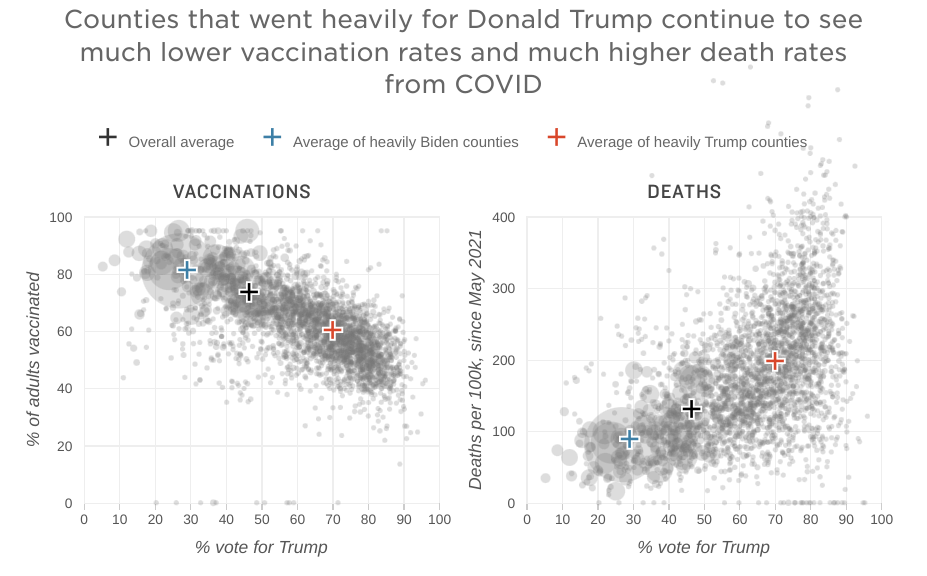
NPR examined COVID deaths per 100,000 people in roughly 3,000 counties across the U.S. from May 2021, the point at which most Americans could find a vaccine if they wanted one. Those living in counties that voted 60% or higher for Trump in November 2020 had 2.26 times the death rate of those that went by the same margin for Biden. Counties with a higher share of Trump votes had even higher mortality rates.

Follow the latest news and policy debates on sustainable agriculture, biomedicine, and other ‘disruptive’ innovations. Subscribe to our newsletter.

“How you vote should not predict whether you die of COVID,” says Jennifer Nuzzo, an epidemiologist at Brown University School of Public Health. The social causes of the divide are complex, but the immediate reason is dead simple: Trump-leaning counties have far lower vaccination rates than those that went for President Biden. NPR’s analysis showed that the gap was 21 points, with 81% of adults vaccinated in heavily-Biden counties compared to 60% of adults in counties that went for Trump.

Death rates are cumulative COVID-related deaths since January 2020. Averages are weighted by county population. The overall average represents the average of the 3,014 counties included in the analysis. “Heavily Trump” indicates a county that voted for Trump at 60% or more. “Heavily Biden” indicates a county that voted for Trump at 40% or less. Data is as of May 18, 2022. Credit: Daniel Wood/NPR
Circle sizes reflect population. Vaccination rates are percent of 18+ population fully vaccinated. Death rates are new COVID-related deaths since May 2, 2021. Averages are weighted by county population. The overall average represents the average of the 3,014 counties included in the analysis. “Heavily Trump” indicates a county that voted for Trump at 60% or more. “Heavily Biden” indicates a county that voted for Trump at 40% or less. Data is as of May 18, 2022. Credit: Daniel Wood/NPR

This is an excerpt. Read the original post here

{{ reviewsTotal }}{{ options.labels.singularReviewCountLabel }}
{{ reviewsTotal }}{{ options.labels.pluralReviewCountLabel }}
{{ options.labels.newReviewButton }}
{{ userData.canReview.message }}
skin microbiome x final

Infographic: Could gut bacteria help us diagnose and treat diseases? This is on the horizon thanks to CRISPR gene editing

Humans are never alone. Even in a room devoid of other people, they are always in the company of billions ...
glp menu logo outlined

Newsletter Subscription

* indicates required
Email Lists
glp menu logo outlined

Get news on human & agricultural genetics and biotechnology delivered to your inbox.