
This paper estimates the annual global carbon dioxide equivalent (CO2e) emissions from the manufacture, distribution and farm level use of glyphosate and estimates the annual contribution of glyphosate to reducing CO2e emissions through its role in facilitating a shift in farming production practices that are tillage-based into conservation tillage systems based on reduced and no tillage. Total annual global use of glyphosate is 749.27 million kg of active ingredient, applied to 646.11 million (spray) hectares. The CO2e emission generated from the manufacture, distribution and application of glyphosate in global agriculture is annually 9.76 billion kg. The total global combined annual fuel and soil carbon retention-related CO2e emissions of conservation tillage are a net reduction of −138.2 billion kg CO2e. This compares with +41.47 billion kg CO2e emissions if this area had been plowed with conventional tillage practices.
Therefore, conservation tillage practices provide a net reduction in combined annual fuel and increased soil carbon retention-related emissions of −179.67 billion kg CO2e relative to a conventional plow-based alternative production system. The total global combined annual fuel and soil carbon retention-related CO2e emissions of conservation tillage attributable to glyphosate is estimated at a net reduction of −41.93 billion kg CO2e. This compares with +13.01 billion CO2e emissions if this area had been plowed, providing a net reduction in combined fuel and soil carbon-related emissions attributable to glyphosate of −54.94 billion kg CO2e annually or the equivalent of taking 21.8 million cars off the road each year.
The objectives of this analysis were to firstly quantify the annual global CO2e emissions associated with the manufacture, distribution and farm level application of glyphosate and secondly, to estimate the possible annual contribution of glyphosate to reducing CO2e emissions through its role in facilitating a shift in farming production practices that are tillage-based into conservation tillage systems founded on reduced and no tillage.
Literature Review
The extent to which conservation tillage farming systems (COT) increase the amount of organic carbon stored or sequestered in the soil has been examined in numerous papers, many of which are in peer reviewed journals. These are summarized in Appendix one and include meta-analyses.
Whilst there are some publications and meta-analyses that argue there are little or no changes in total soil organic carbon (SOC) levels associated with changes from a CT-based tillage production system to NT/RT-based systems (e.g., Hermle et al., 2008Citation1, Powlson et al., 2011Citation2,2014Citation3), there is a significantly larger body of evidence that argues that SOC levels increase as a result of the adoption and maintenance of RT/NT systems. Some of the key sources arguing that conservation tillage systems increase SOC levels include the Intergovernmental Panel on Climate Change (IPCC, 2006Citation4), Robertson et al. (2000Citation5), Johnson et al. (2005Citation6), Calegari et al. (2008Citation7), Baker et al. (2007Citation8), Angers and Eriksen-Hamel (2008Citation9), Blanco-Canqui and Lal (2008),Citation10 Lal (2004Citation11), Lal (2005),Citation12 Lal (2010Citation13), Bernaccchi et al. (2005Citation14), Michigan State University (2016Citation15), Buragiene et al. (2019Citation16), Mangalassery et al. (2014Citation17), Nicoloso and Rice (2019Citation18), Haruna and Nkongolo (2019Citation19), Haddaway et al. (2017Citation20), Hassan et al. (2022Citation21), Ogle et al. (2019Citation22), Ogle et al. (2023Citation23), Mazzonicini et al. (2016Citation24), Abdulla et al. (2016Citation25), Liang B et al. (2020Citation26), Corsi et al. (2012Citation27), Sá et al. (2020Citation28, 2024Citation29 and 2025)Citation30 and Reicosky and Kassam (2022Citation31).
The literature highlights difficulties in estimating the precise contribution conservation tillage systems make to soil carbon sequestration levels and variations between the findings of different research finding reflect a variety of reasons. These include:
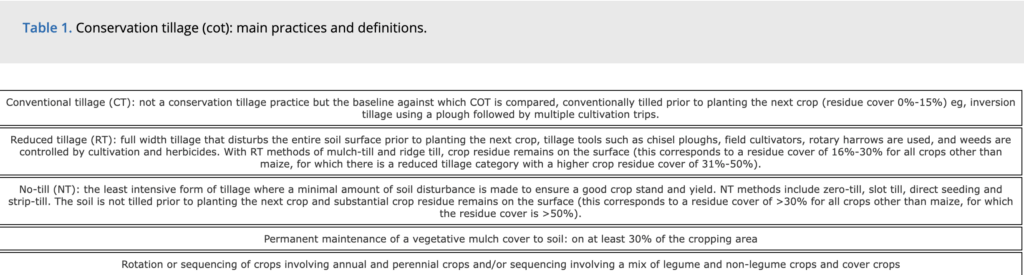
- The duration of studies: due to factors such as seasonal climate changes, land use and land management changes, 10 years is generally considered to be the minimum required;
- The depth at which soil organic carbon levels are measured – there is widespread agreement that there is a positive relationship between conservation tillage and soil organic carbon (SOC) deposition in the top 15 cm of soil, though this diminishes below 15-30 cm (Abdulla et al., 2016Citation25);
- Soil type: soil type does not influence the effects of tillage on SOC stocks or concentrations from 0 to 15 cm, but does influence the effects deeper down (15-30 cm), SOC concentrations tend to be greater in sandy clay loam and silty clay soils under NT compared to tillage (Haddaway et al., 2017Citation20);
- Latitude/Climate: differences in SOC between NT and tilled soils may be greater in arid rather than humid climates (Abdulla et al., 2016Citation25);
- The interaction of conservation tillage with other management practices such as crop cover, crop rotation or sequencing;
- If a specific crop area is in continuous conservation tillage crop rotation, the full soil carbon sequestration (storage) benefits described in most literature can be realized. However, if the conservation tillage crop area is returned to a conventional (plow-based) tillage system, a proportion of the soil organic carbon gain will be lost. This means that carbon storage only becomes permanent when farmers adopt a continuous conservation tillage system which, in turn, is highly reliant on effective weed control (typically herbicide-based);
- Some researchers argue that level of soil organic carbon (SOC) reaches an equilibrium when the amount of carbon stored in the soil equals the amount of carbon released (the Carbon-Stock Equilibrium (CSE): e.g., Hassink, 1997Citation32, Georgiou et al., 2022Citation33). This hypothesis implies that as equilibrium is reached, the rate of soil carbon sequestration may decline and therefore if equilibrium is being reached after 20 to 25 years of land being in conservation tillage, the subsequent rate of soil carbon sequestration may decline. This CSE hypothesis is, however, not universally accepted and other researchers question whether applying a CSE assumption in soil models is valid because of the scope for very old soils to continue to store carbon. For example, Lal (2004)Citation11 and Ussiri and Lal (2009)Citation34 observed increases in SOC in the top 30 cm of soil of 1.37 Mg C ha−1 year−1 (1,370 kg of carbon (C) ha−1yr1) after 43 years of continuous maize under no tillage. This compared with a rate of 0.73 Mg C ha−1 year−1 (730 kg of C ha−1yr1) for maize grown using conventional tillage (Ussiri and Lal, 2009Citation34);
- The combined effect of temperature, moisture levels, soil texture and depth also affect SOC levels. Ogle et al. (2019)Citation24 identified that the depth of significant SOC additions with NT practices is highest for warm, dry, loamy, silty and clayey soils down to at 70 cm depth but only down to 5 cm for cool, dry, loamy, silty and clayey soils/tropical dry, sandy soils with the most temperature/moisture/soil texture combinations showing significant differences down to 30 cm depth. Across most of these temperature/moisture/soil type combinations, the “delta” SOC increase provided by the adoption of NT tillage estimated by this paper was within the range of 150 C ha−1yr1 to 540 kg C ha−1yr1.
It is also noteworthy that the key authority assessing and monitoring global emissions, the IPCC and several other complex national modelsFootnotea available to estimate the level of carbon sequestered in agricultural (cropping) production systems assume a constant rate of carbon sequestration occurs for at least up to 20 years. The IPCC, for example, assumes a twenty-year total for SOC deposition and “slices this up” into 20 equal parts for quantification over a 20-year period.
Some research has also suggested that NT- based system adoption may lead to increases in nitrous oxide (N2O) emissions and hence result in the overall carbon footprint of NT systems being negative (Don and Jantz, 2013Citation35). This assertion was assessed in detail in a meta-analysis by Freitag et al. (2024Citation36 which reviewed 88 papers, 50 of which were examined in the Don and Jantz paper. Freitag et al. review of this literature concluded that “overall the claim by Don and Jantz, 2013 was not confirmed by this literature review. On the contrary, it seems that the long-term absence of tillage, together with permanent soil biomass cover and diverse crop vegetation, can reduce N2O emissions”. Analysis by Karki et al. (2025)Citation37 of 90 nitrous oxide observations also concluded that conservation tillage agriculture with cover crops does not affect nitrous oxide emissions.
The use of fossil fuel energy for agricultural machinery in NT and RT systems also contributes further to reductions in CO2e emissions with NT/RT production-based systems using less fuel for soil preparation than CT-based systems of production. Specific research at a regional or country level that confirms this includes Australia (Maraseni and Cockfield, 2011Citation38), Spain (Hernanz et al., 2014Citation39 and Marguez et al., 2011Citation40), Slovenia (Stajnko et al., 2009)Citation41 and the USA (Conservation Effects Assessment Project: CEAP, 2016Citation42). For example, the CEAP-Crop Conservation Insight report for 2016 estimated that annually in the USA the widespread adoption of conservation tillage has resulted in a fuel use reduction of 3,075.3 million liters of diesel equivalents, within which the application of NT accounted for 72% of the total reduction in fuel use.
Complex national models such as the USDA’s Energy estimator for Tillage ModelCitation43 and The Voluntary Reporting of Greenhouse Gases-Carbon Management Evaluation Tool (COMET-VRCitation44 that estimate the level of carbon sequestered in agricultural (cropping) production systems also assume that NT/RT-based systems use less fuel for tillage than CT-based systems. For example, the Voluntary Reporting of Greenhouse Gases-Carbon Management Evaluation Tool (COMET-VRCitation44 uses a reduction of 41.8 litres/ha when CT is replaced by NT on non-irrigated maize and a reduction of 59.7 litres/ha in the case of soybeans in Nebraska.
Moving onto glyphosate’s influence in facilitating the adoption and maintenance of conservation tillage practices, this primarily stems from its part in providing an effective form of weed control, especially in the land preparation phase before field crops like cereals and oilseeds are planted. This is particularly important in relation to GM HT (tolerance to glyphosate) based production systems but is also of relevance to conventional production systems.
The importance of GM HT (tolerant to glyphosate) technology in the adoption of NT/RT systems was first highlighted by the American Soybean Association (ASA: 2001)Citation45 and CTIC (2002Citation46). The ASA study, for example, found that the availability of GM HT soybeans facilitated and encouraged farmers to implement reduced tillage practices; most growers surveyed indicated that GM HT soybean technology had been the factor of greatest influence in their adoption of reduced tillage practices. Fernandez-Cornejo et al. (2012)Citation47 also concluded over an eleven-year period (1996–2006) that GM HT soybean adoption had led to a significant increase in the adoption of conservation tillage (RT/NT) with a one percent increase in GM HT soybean adoption leading to a 0.21% increase in conservation tillage.
Similarly, Finger et al. (2009Citation48: based on a survey of Argentine soybean growers) identified that the combination of herbicide tolerance and NT were the key drivers to adoption of GM HT soybeans, facilitating easier crop management and reducing herbicide costs.
In addition, Perry et al. (2016)Citation49 reviewed 51 papers examining the evidence for a relationship (complementarity) between the adoption and use of glyphosate tolerant crops and conservation tillage practices. It concluded that the evidence in favor of complementarity between glyphosate tolerant crops and conservation tillage outweighs the evidence against it. The research further examined the relationship using farm level data from the US for nearly 30,000 soybean farmers over the period 1998–2011 and confirmed complementarity, with adoption rates for CT and NT estimated to have been 10% and 20% respectively higher than would otherwise have occurred in the absence of glyphosate tolerant soybean technology. Other analysis identifying correlations between glyphosate use, GM HT crops and carbon sequestration include Sunderland et al. (2021)Citation50 relating to Canada and Rodriguez et al. (2021)Citation51 relating to Argentina.
There is also broad consensus that glyphosate plays an important role in facilitating the adoption and operation of conservation tillage systems in conventional cropping systems (Wynn and Webb, 2022Citation52, Walsh and Kingwell, 2021Citation53, Loureiro et al., 2019Citation54, Page et al., 2020Citation55, Prado, 2021Citation56, Brookes, 2019Citation57).
In Europe, where conservation tillage usage is solely in conventional cropping systems and less widespread than in North and South America, the widespread use of glyphosate reflects its broad spectrum of activity and relative low number and incidence of weed resistance. This is related to the widespread resistance of some key weed species like blackgrass (Alopecurus myosuroides) to many selective herbicides with different modes of action which has left limited chemical control alternatives for the control of this highly competitive weed (Moss, 2017Citation58).
As glyphosate is rarely used in isolation for weed control in the land preparation and between crop period, key to facilitating conservation tillage production systems in both GM HT and conventional crops, only a proportion of all greenhouse gas emission savings associated with the application of conservation tillage practices can be reasonably attributed to glyphosate use.
Nevertheless, whilst conservation tillage can be practiced from a technical perspective without the use of glyphosate and/or other herbicides, the research evidence discussed above and data available on conservation tillage areas, crops typically grown within the system (largely cereals, oilseeds, pulses) and the area of these crops regularly receiving applications of herbicides and glyphosate, shows that the vast majority of crops grown under conservation tillage use herbicides as the primary form of weed control and within this, glyphosate is the most applied herbicide. Farmer survey-based research about the reasons for the dominance of herbicide use and within this, a preference for glyphosate being in the mix of active ingredients used (e.g., Brookes, 2019Citation57, Wynn and Webb, 2022Citation52, Walsh and Kingwell, 2021Citation53, ASA, 2001Citation45, CTIC, 2002Citation46 Sunderland et al., 2021)Citation50 show a consistent response.
The high prevalence of herbicide-based weed control programs featuring glyphosate in conservation tillage agriculture reflects a combination of the weed control efficacy provided allied to cost effectiveness. Much of the same cited research above also shows that when questioned about how farmers might change their production practices if they no longer had access to glyphosate, a consistent response was that where conservation tillage production was practiced it was likely to be dropped with reversion to a plow-based system.
The literature review also identified that crops typically grown within conservation tillage systems are largely cereals, oilseeds and pulses and almost all crops grown under conservation tillage use herbicides as the primary form of weed control. Within this, glyphosate is the most applied herbicide (Brookes, 2019Citation57, Wynn and Webb, 2022Citation52, Walsh and Kingwell, 2021Citation55, ASA, 2001Citation45, CTIC, 2002Citation46 Sunderland et al., 2021Citation50).
As well as glyphosate use and its role in the adoption of conservation tillage practices facilitating the reductions in greenhouse gas emissions via reduced fuel use and additional soil carbon sequestration, it may also affect GHG emissions via changes to yields and crop profitability. Estimating the possible GHG emissions changes associated with yield changes or impacts on the relative profitability of different crops (which influences planting decisions) is, however, difficult due to the complex array of variables that affect them. Examination of these “knock-on” issues would add considerably to the research requirement and length of any subsequent paper. As such, no estimates are provided in this report, which focuses on the core assessment of the direct impact of glyphosate use on GHG emissions, inclusive of its role in facilitating conservation tillage practices.
Nevertheless, in furthering the debate about the potential GHG emission impacts associated with the use of glyphosate via knock on effects associated with yield changes and crop production mixes, several effects could arise. Glyphosate use may lead to improved weed control which in turn leads to higher yielding crops (e.g., as experienced with the adoption of GM HT technology in soybeans in Romania, maize in Vietnam and the Philippines: Brookes, 2022aCitation59). Higher yielding crops assimilate more carbon dioxide into carbohydrate, oxygen and water than lower yielding crops (Simpkin et al., 2019Citation60). Increasing crop yields can also result in an increase in carbon inputs from crop residues into soils which have a positive effect on soil carbon stocks (Berntsen et al., 2006Citation61).
Improved yields and additional production from second cropping (e.g., of soybeans in South America after the introduction of GM HT technology in the mid-1990s: Brookes, 2022aCitation59 effectively “replaces” the need to extend crop production into new lands (which will require the switching of land uses from other crops, grazing land and/or non-agricultural land converted into cropping of soybeans, maize, cotton and canola). Where this land that would otherwise have been brought into agriculture remains in alternative uses that sequester important levels of GHGs (e.g. forestry), it is likely that the net effect on GHG emissions is positive. Intensification of production is also crucial if new land is not to be brought into production. For example, analysis by Tilman et al. (2011Citation62 into meeting projected global food demand by 2050 suggests that moderate intensification delivers significant (three-fold) greenhouse gas emission savings compared to a scenario of no additional intensification.
Methodology
Quantification of Global Glyphosate Use
To provide a baseline for estimating the annual CO2e emissions associated with the use of glyphosate, data on the use of glyphosate globally was collected and analyzed. Data was compiled from a combination of sources including nationally published sources (e.g., United States Department of Agriculture National Agricultural Statistical Service: USDA NASS (in the USA), private market research and subscription service providers like Kynetec (and formerly from Kleffmann), trade data, the author’s own estimates, as well as additional supporting literature.
The baseline used for the analysis was the annual usage of glyphosate in global agriculture based on the average annual global use of glyphosate across the most recent four years for which comprehensive data was available (2019–2022). This means that the CO2e emissions calculated for the manufacture, production, distribution and application of glyphosate directly relate to the average annual usage in the period 2019–2022.
Calculation of Emissions from Glyphosate Manufacture, Distribution and Farm Level Use
There is a very limited literature available that examines the CO2e emissions from the activities of manufacturing and distributing pesticides to farmers. Where papers have been identified, they are not recent, for example Audsley et al. (2009Citation63), which itself draws on data going back into the 1990s.
The most current and detailed source available is EcoInventCitation64, the database of lifecycle inventory data. This dataset is widely used by businesses around the world to assist with calculations of emissions that are required to fulfill legal environmental reporting requirements. The dataset is also utilized by the International Panel on Climate Change (IPCC). The carbon dioxide generation from the manufacture and distribution of glyphosate from this source is 11.2 kg per kg of active ingredient (EcoinventCitation60, accessed March 2025)
Emissions associated with the application of glyphosate arise from fuel use in application where mechanical forms of application are used. The fuel used in a typical method of mechanical application is with a 90-foot boom sprayer. Literature examining the fuel used for the application of pesticides, including herbicides, was reviewed including periodically updated national and regional farmer management and extension type guides around the world. These sources all broadly show a consistent narrow range of fuel usage of between 0.5 liters per hectare and 1 liter per hectare. For example, Bowling J (2008)Citation65 found (in Australia) a range of 0.5 to 1.01 liters per ha. The core analysis in this paper uses 0.84 liters/ha drawn from Lazarus (2019)Citation66 that relates to the USA although sensitivity analysis is also presented to the full range of 0.5 liters/ha to 1 liter/ha.
Based on this, in terms of GHG emissions, each liter of tractor diesel consumed contributes an estimated 2.67 kg of carbon dioxide into the atmosphere (one application emits 2.24 kg/ha carbon dioxide within a range of 1.335 kg/ha if 0.5 litres/ha is the assumed fuel use to 2.67 kg/ha if 1 liter of fuel is the assumed fuel use). As some farmers, mostly in developing countries, apply agrochemicals by hand and do not use any fuel during application, this factor has been taken into consideration in the analysis by reducing the total spray area of glyphosate to which the fuel-related emissions have been assumed to have been applied. For example, for India, the application fuel use and associated emissions have been applied to only 15% of the total glyphosate spray area, reflecting the limited use of mechanical spray application in a country where the average size of farm growing cereals and oilseeds is under 1 hectare.
Literature Review
A primary aim of the literature review was to identify the evidence about emissions after adoption of conservation tillage practices, soil organic carbon levels and other possible emissions such as nitrous oxide (N2O) relative to conventional tillage practices. This review (see Introduction, specific Literature Review section, Appendix 1 and Supplementary material) provided the evidence for setting assumptions for calculating emission savings associated with the adoption of conservation tillage practices (see below). In addition, the literature review provided the evidence for confirming the facilitating role of glyphosate in the adoption and maintenance of NT/RT-based conservation tillage practices.
Calculation of Emissions Reduction from the Use of Conservation Tillage
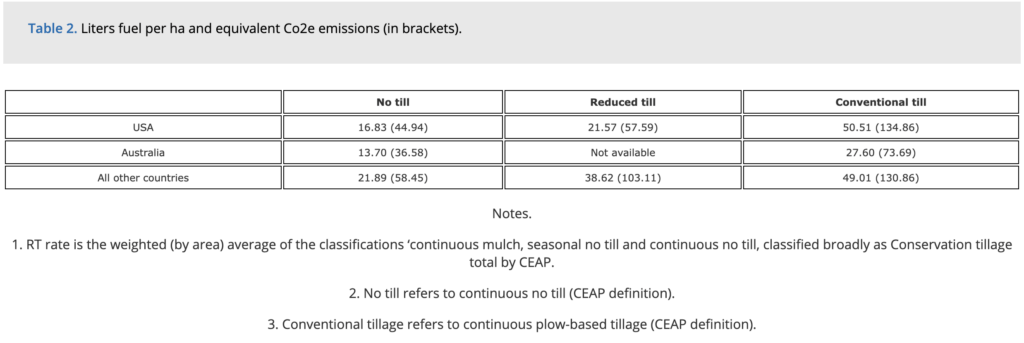
The fuel use assumptions for conservation tillage practices used in this paper are drawn from a review of literature, in particular the USDA’s Conservation Effects Assessment Project (CEAP: 2016Citation42), CTIC (2002Citation46), the USDA Energy Estimator for Tillage Model (2013Citation43 and the online USDA Comet-VR model (2014Citation44). In addition, country-specific data such as for Australia are drawn from relevant literature (Maraseni T and Cockfield G, 2011Citation38). These are detailed in Table 2.
The soil carbon storage assumptions are also drawn from the literature review and complex models cited. The analysis presented in the results section uses assumptions that country-specific, where available, and in the absence of these draws on conservative values that take into consideration the finding of assumptions drawn from meta-analyses. These are as follows:
USA:.US-specific papers on soil carbon storage with conservation tillage identified a range of estimated values. These include 100 kg C ha−1yr−1 to 500 kg C ha−1yr−1 range (Kassam et al., 2019Citation67), 570 C ha−1yr−1 (West and Post, 2002Citation68), 240 C ha−1yr−1 to 400 C ha−1yr−1 (Lal 1999Citation69 and 230 C ha−1yr1 to 320 C ha−1yr1 (Ogle, 2019Citation22). For this analysis, the US-specific assumption for the difference between NT and CT tillage has been 275 C ha−1yr−1 based on NT systems store 250 kg C ha−1yr1 compared to CT systems that emit 25 kg C ha−1yr1
Argentina, Brazil and other countries of South America: The soil carbon retention assumption used is 175 kg C ha−1yr1 for NT soybean cropping and CT systems release 25 kg C ha−1yr1 (a difference of 200 kg C ha−1yr1). This is a conservative estimate based on Alvarez et al. (2014Citation70).
Canada: The soil carbon retention assumption used is NT systems store 211 kg C ha−1yr1 compared to CT systems that emit 10 kg of C ha−1yr1 based on Liang B (2020Citation26)
Italy: The soil carbon retention assumption used is NT systems store 132 kg of C ha−1yr1 compared to CT systems that emit 6 kg C ha−1yr1 (Mazzonicini et al., 2016Citation22).
South Africa: The soil carbon retention assumption used is NT systems store 125 kg C ha−1yr1 compared to CT systems that emit 25 kg C ha−1yr1 (based on Nyambo P, Cornelius C and Araya T, 2020Citation71)
Generic/general (not country specific as estimated based on analysis of data from several countries):
Some of the meta-analysis type studies include:
IPCC (2006 Citation4): all conservation tillage (NT and RT) in North America was estimated to add to SOC levels within a range of 50 C ha−1yr1 to 1,300 kg C ha−1yr1 (it varies by soil type, cropping system and eco-region), with a mean of 300 kg C ha−1yr1;
Haddaway et al. (2017 Citation20). In the upper soil layer (up to 30 cm depth) the NT versus CT difference was equal to 460.6 kg C ha−1yr1 (drawn from 351 studies)
Ogle et al., 2019 Citation22. Across most of these temperature/moisture/soil type combinations, the “delta” SOC increase provided by the adoption of NT tillage estimated in this paper was within the range of 150 C ha−1yr1 to 540 kg C ha−1yr1.
Given the range of possible impacts identified in meta studies, the analysis uses values at the conservative end of the range for all countries where no country-specific analysis is available. Thus, the general values used are those referred to above for South American countries, soil carbon retention of 175 kg C ha−1yr1 for NT soybean cropping and CT systems release 25 kg C ha−1yr1 are used for all other countries.
The baseline global area of land using conservation tillage practices used in the analysis is 202.8 million hectares. The primary source for this is Kassam et al., 2022Citation72, https://www.ca-global.net/ca-stat), although other sources, including FAO, CEAP (USA), Eurostat). The years from which this dataset relates vary according to differences in the availability of data by country. As the baseline year for conservation tillage areas used in the most comprehensive data source, Kassam et al., 2022Citation72 is 2018/19, this is the baseline used, except for the USA, where the average annual continuous NT area recorded by the latest CEAP survey for the 2013–2016 was used.
Calculation of Contribution of Glyphosate to Emissions Reduction from the Use of Conservation Tillage
Calculating the contribution of glyphosate to emissions reductions associated with conservation tillage involved the following stages:
- Firstly, identification of evidence of a link between glyphosate use and adoption/maintenance of NT/RT-based conservation tillage practices;
- Establishment of a methodology for estimating the contribution of glyphosate use to annual CO2e emissions associated with conservation tillage practices
The literature review provided the first step to identify any link between glyphosate use and adoption/maintenance of NT/RT-based conservation tillage. This review, as discussed in the introduction and earlier specific literature review section, confirmed that glyphosate plays an important role in facilitating the adoption and maintenance of conservation tillage practices. This is particularly important in relation to GM HT (tolerance to glyphosate) based production systems but is also of relevance to conventional production systems.
Based on the literature review, the methodology applied to estimate a contribution of glyphosate share to GHG savings associated with the adoption and use of NT/RT-based conservation tillage practices was as follows:
For Conventional Crops
- Identification and quantification of all herbicides used (in terms of spray areas) for weed control in the pre-plant/between successive crops and pre-emergence phase in the main crops typically grown under conservation tillage systems (primarily cereals and oilseeds) by country;
- Within this dataset, identification and quantification of the specific spray area of glyphosate used in these phases of production for the main crops in which conservation tillage are typically used, by country.
For GM HT Crops (Tolerant to Glyphosate)
- The same approach was applied to conventional crops – based on the (spray area) share of glyphosate relative to other herbicides in the pre-plant/between crops and pre-emergence phase;
- Identified the share of total GM HT crops solely tolerant to glyphosate relative to GM HT crops tolerant based on estimates of GM HT trait-specific seed sales in the crops where GM HT are used (corn, cotton, canola and soybeans).
Results
The sub-sections below detail the results calculated in the research, drawing on the datasets and assumptions referred to in the methodology section. To further assist readers in following how these calculations have been made, additional detailed information that takes readers through the estimates for one country (Argentina) has been provided in Appendix 3.
Glyphosate Use
Total Global Glyphosate Use
Worldwide annual herbicide use, based on an annual average of usage over the period 2019 to 2022 is about 1,690 million kg of active ingredient applied to about 2,929 million hectares (spray hectares, not crop hectares). Within this, total annual global use of glyphosate was 749.27 million kg of active ingredient, which was applied to 646.11 million hectares (spray hectares). Therefore, in terms of total global herbicide use, glyphosate accounts for about 44% of the total volume of herbicide active ingredient use and 22% of the total herbicide spray area.
The main country-level users of glyphosate are Brazil, the USA and Argentina, followed by China, South Africa, Canada, Australia, the European Union, Paraguay and India (Table 3).
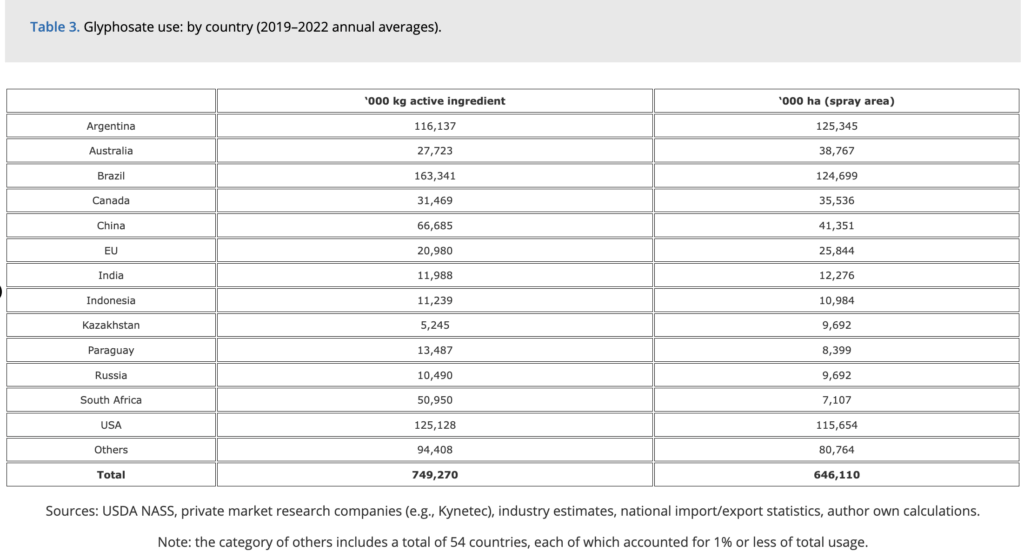
In terms of the glyphosate spray area, the largest users are also Argentina, Brazil and the USA, followed by China, Australia, Canada, the EU, India, Indonesia, Russia, Kazakhstan, Paraguay and South Africa (Table 3).
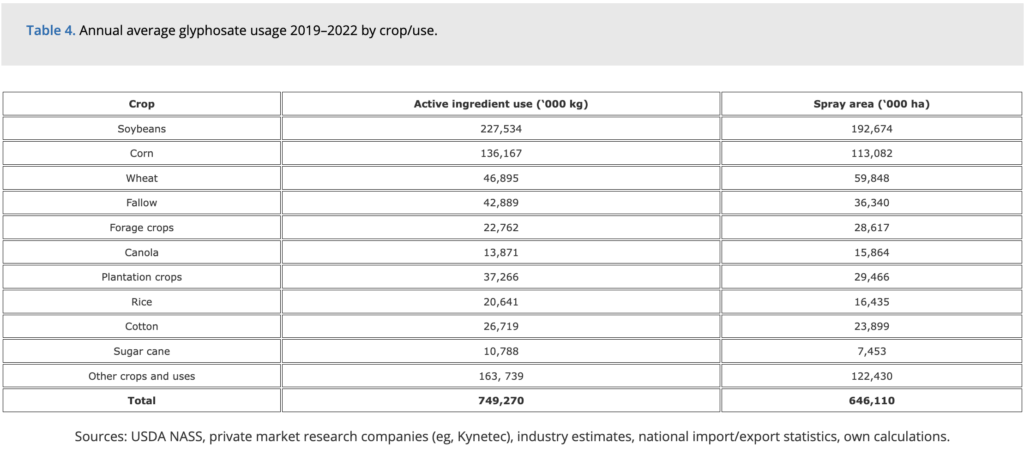
By crop use, Table 4 shows that the main crops in which glyphosate use occurs are soybeans and corn which account for 30% and 18% respectively of total use. The other main user sectors are wheat, fallow, forage crops, plantation crops and cotton.
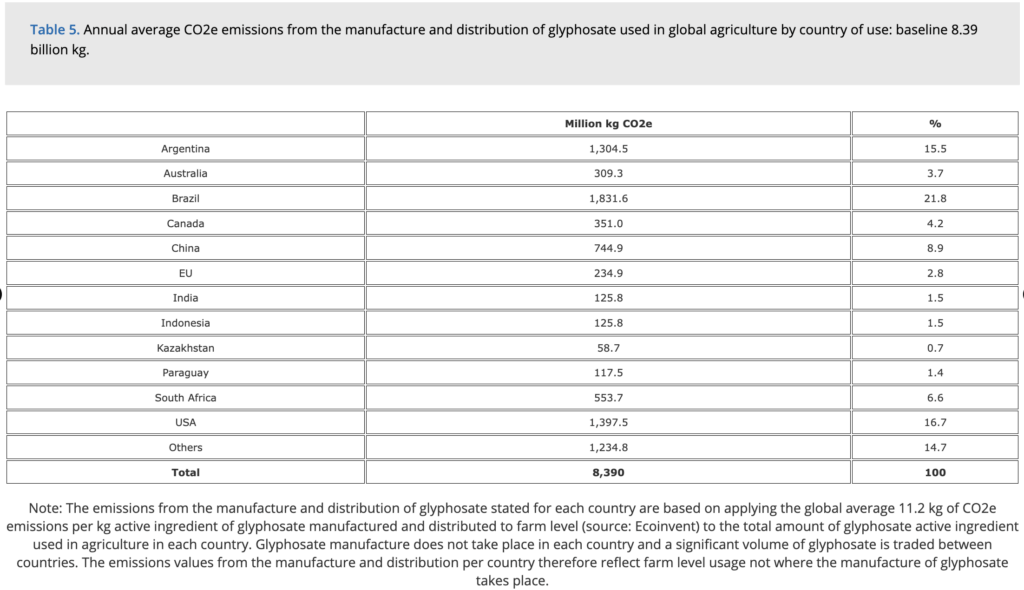
As discussed in the methodology section, the carbon dioxide generation from the manufacture and distribution of glyphosate is 11.2 kg per kg of active ingredient (EcoinventCitation60). Applying this value to the annual volume of glyphosate use (749.27 million kg of active ingredient), the total amount of CO2e emissions associated with the annual manufacture and distribution of glyphosate used in global agriculture is 8.39 billion kg. A breakdown of these emissions by country where the glyphosate is distributed to for use is provided in Table 5 and a more detailed breakdown for all countries is available in Appendix 2.
These estimates exclude emissions associated with the formulation of products that contain glyphosate. Emissions associated with formulations vary by formulation and the author is not aware of any source that adds this level of detail. It is likely that the emissions associated with formulation are small relative to the 11.2 kg CO2e calculated by the Eco Invent resource.
CO2e Emissions from the Application of Glyphosate
Based on the assumption that 0.84 liters of fuel are used per hectare sprayed with glyphosate (and its equivalent value of 2.24 kg carbon dioxide emitted per hectare of crop sprayed), and applying this to the annual volume of glyphosate used in global agriculture, the total annual amount of CO2e emissions associated with the application of glyphosate by farmers used in global agriculture is 1.37 billion kg. A full breakdown by country is provided in Appendix 2.
If the CO2e emissions are calculated around the main range of fuel used to apply herbicides around the world (0.5 to 1 liter of fuel per spray ha), the total annual CO2e emissions associated with the application of glyphosate are within a range of 0.82 billion kg and 1.63 billion kg.
CO2e Emissions from the Use of Conservation Tillage
The analysis presented below uses the fuel use and soil carbon storage assumptions drawn from the literature review applied to the estimated global area using conservation tillage (201 million ha: Sources Kassam et al., 2022Citation72, CEAP, 2016Citation42).
The total annual fuel-related CO2e emissions associated with NT/RT-based conservation tillage operations is 10.44 billion kg CO2e emissions (Table 6). This compares with 23.54 billion kg CO2e emissions if this area had been plowed using CT, providing a net reduction in fuel-related emission of 13.1 billion kg CO2e emissions (−55.6%).
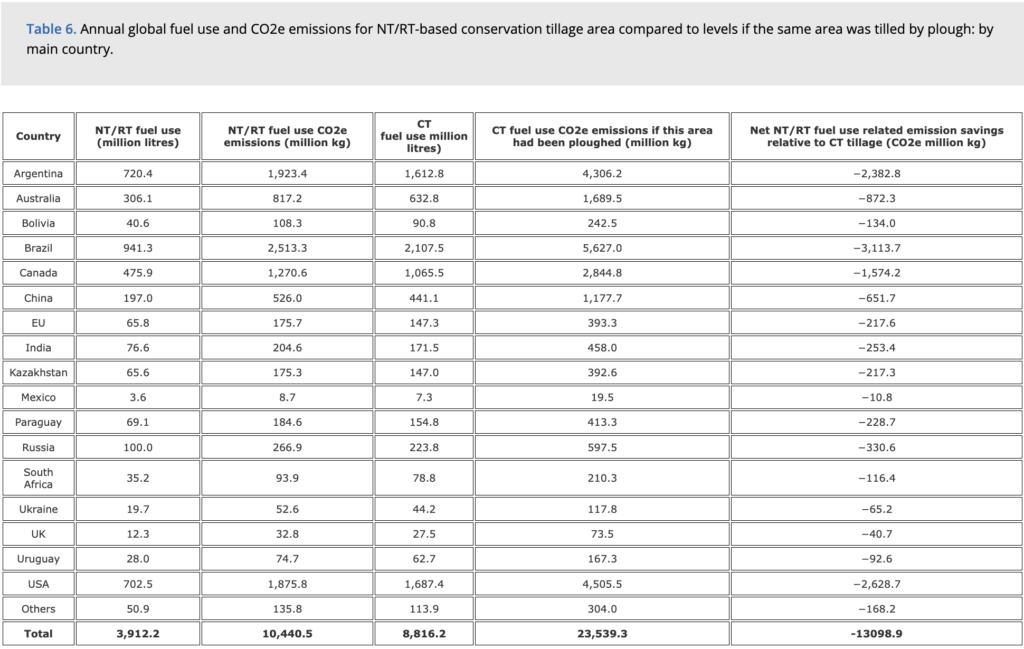
Table 6 and Table 7 also show that the main grain and oilseed producing and exporting countries of North and South America dominate CO2e emission reductions associated with the use of conservation tillage practices, accounting for over 70% of the total. These countries (USA, Canada, Argentina, Bolivia, Brazil, Paraguay and Uruguay) are also countries where GM HT crop technology has dominated production systems for more than 20 years.
The total global combined annual fuel and soil carbon retention-related CO2e emissions of conservation tillage (Table 6 and Table 7) is a net reduction of −138.2 billion kg CO2e. This compares with +41.47 billion kg CO2e emissions if this area had been plowed, providing a net reduction in combined annual fuel and soil carbon retention-related emissions of −179.67 billion kg CO2e.
Glyphosate Use in the Land Preparation and Between Crop Period, Key to Facilitating Conservation Tillage Production Systems in Both GM HT and Conventional Crops
The methodology applied to estimate the contribution of glyphosate share to GHG savings associated with the adoption and use of NT/RT-based conservation tillage practices is based on identification and quantification of all herbicides used (in terms of spray areas) for weed control in the pre-plant/between successive crops and pre-emergence phases of production in the main crops typically grown under conservation tillage systems (primarily cereals and oilseeds) at the country level. This identified that about 35% of total usage (by active ingredient volume) is in the pre plant and pre-emergence phases, 32% is post emergent and harvest phase and 33% is classified as “undefined” use. Most of the undefined use relates to use in countries like India and China where use data to this level of disaggregation is limited.
Analysis of all herbicides used and specifically glyphosate use in the crops and categories of use/stage of crop development of most relevance to conservation tillage (Table 8) shows:
- In relation to total herbicide use, the total amount of herbicide active ingredient used in the relevant categories of use/stages of crop development for conservation tillageFootnoteb is 1,143.4 million kg, equal to 68% of total herbicide use (in relation to area sprayed, it is 58% of the total spray area, equal to 1,713 million ha);
- Further focusing on the main crops in which conservation tillage is practiced (largely cereals, including rice, oilseeds and “fallow”), total annual herbicide use is 534.6 million kg (32% of total herbicide active ingredient use) on 977.1 million spray hectares (33% of the total herbicide spray area);
- Glyphosate use in the relevant stages of (crop) development in crops most grown under conservation tillage is annually 237.7 million kg of active ingredient use and 213.5 million spray hectares. This is equivalent to 44% of total herbicide active ingredient use and 21.8% of the total spray area on crops most grown under conservation tillage.
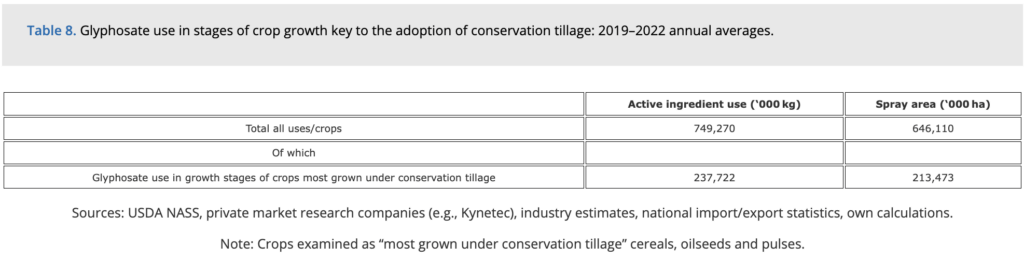
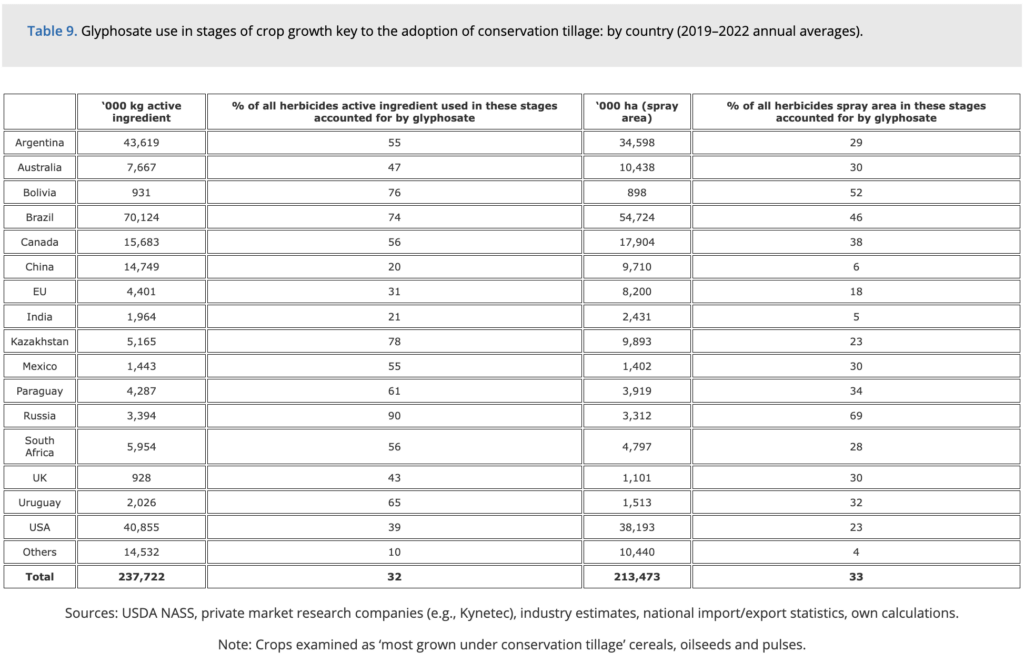
Table 9 provides a breakdown of this glyphosate use by country, with nearly three-quarters of total use being in North and South American countries which have the highest levels of conservation tillage adoption and where GM HT tolerant crops (notably corn and soybeans) dominate production systems.
CO2e Emission Removal Savings Associated with Soil Carbon Sequestration with Conservation Tillage Practices Attributable to Glyphosate
The results presented below are based on applying the country-specific shares of glyphosate (in terms of spray area) in total herbicide use in the crops and categories of use/stage of crop development of most relevance to conservation tillage (Table 8 and Table 9) to the fuel use and soil carbon storage values identified above (see Table 7).
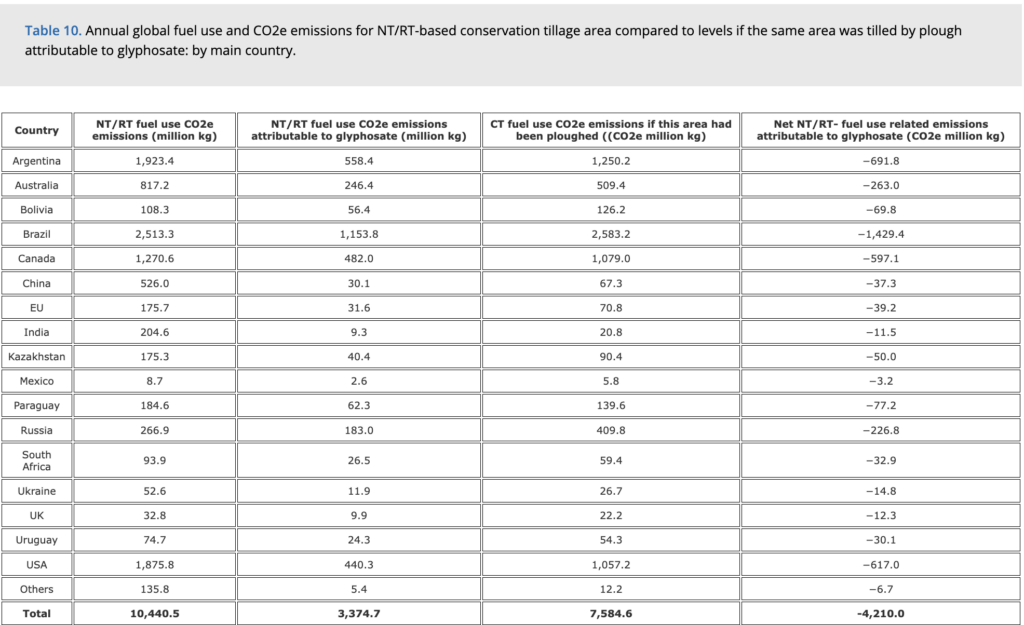
The total annual fuel-related CO2e emissions associated with conservation tillage operations attributable to glyphosate is +3.37 billion kg CO2e emissions (Table 10). This compares with +7.58 billion kg CO2e emissions if this area had been plowed attributable to glyphosate, providing a net reduction in fuel-related emission attributable to glyphosate of −4.21 billion kg CO2e emissions.
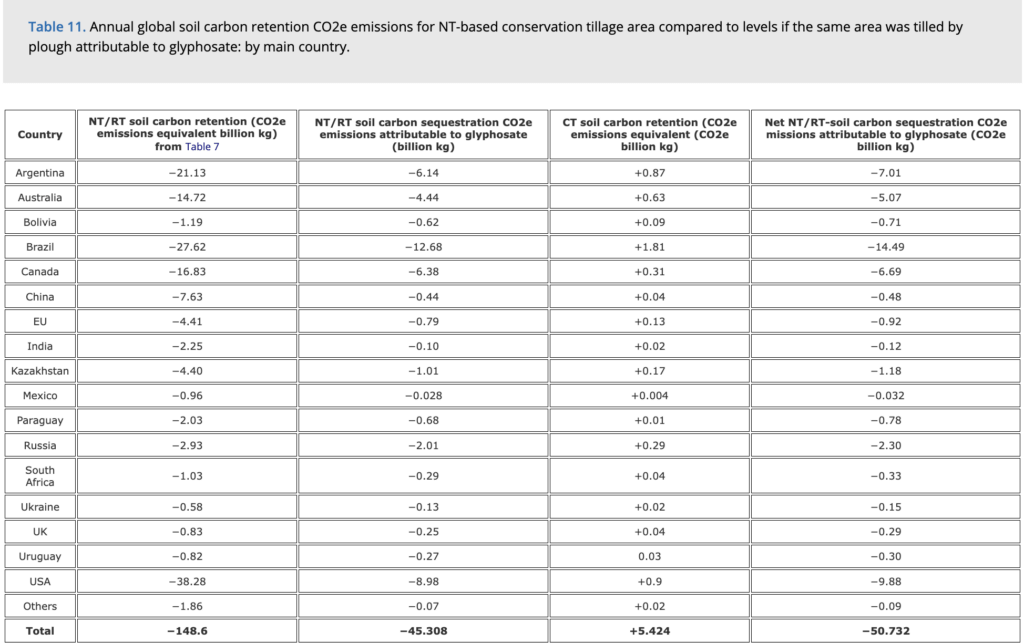
The total annual soil carbon storage/sequestered associated with the conservation tillage area attributable to glyphosate was −45.3 billion kg CO2e. This compares with +5.4 billion kg CO2e emissions if this area had been plowed, providing a net reduction in soil carbon storage-related emissions attributable to glyphosate of −50.73 billion kg CO2e (Table 11).
The total global combined annual fuel and soil carbon retention-related CO2e emissions of conservation tillage attributable to glyphosate (Table 10 and Table 11) is a net reduction of −41.93 billion kg CO2e. This compares with +13.01 billion CO2e emissions if this area had been plowed, providing a net reduction in combined fuel and soil carbon-related emissions attributable to glyphosate of −54.94 billion kg CO2e. In terms of the net reduction in combined annual fuel and soil carbon retention-related emissions of conservation tillage, the share attributable to glyphosate is 30.6%. Additional information relating to these calculations for an example country (Argentina) is provided in Appendix 3.
Discussion
Total CO2e Emissions/Removals Associated with the Global Agricultural Use of Glyphosate
A summary of the total CO2e emissions/removals associated with the global agricultural use of glyphosate, inclusive of manufacture, distribution and farm level use of glyphosate and glyphosate’s estimated contribution to conservation tillage-related removals is presented in Table 12.
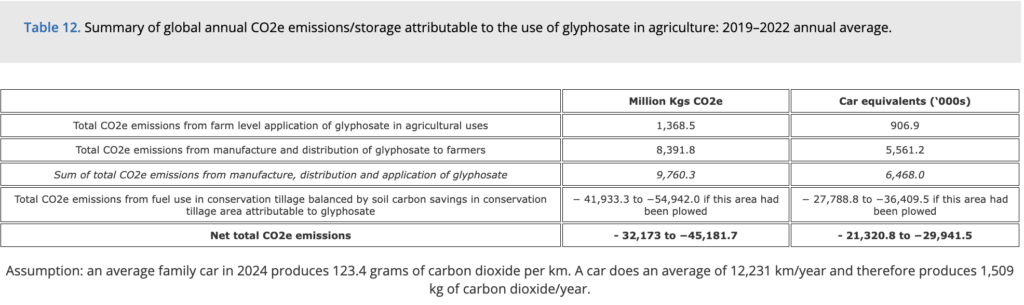
The net annual global impact of glyphosate use is providing a positive contribution to reducing global CO2e emissions arising from agricultural production of between −32.17 billion kg and −45.18 billion kg, equal to taking between 21.3 and 29.9 million cars off the road each year. The net annual global carbon storage with conservation tillage practices attributable to glyphosate is also equal to 30.6% of the total carbon storage associated with conservation tillage practices worldwide.
At an active ingredient level, the CO2e emissions associated with glyphosate manufacture, distribution and application by farmers is 13.03 kg CO2e per kg of active ingredient, balanced against a net CO2e storage associated with conservation tillage-related fuel savings and soil carbon sequestration attributable to glyphosate use of between −55.97 kg CO2e per kg of active ingredient and −73.33 kg CO2e of active ingredient, giving a net balance of between −42.94 kg CO2e per kg of active ingredient and −60.3 kg CO2e of active ingredient.
The point at which the conservation tillage-related fuel savings and soil carbon sequestration attributable to glyphosate cancels out the CO2e emissions associated with the manufacture, distribution and use of glyphosate is 13.03 Kg CO2e per kg of active ingredient. This is equal to between 5.4% and 7.1% of the total global combined annual fuel and soil carbon retention-related CO2e emissions saving from the global use of conservation tillage (presented in Table 6 and Table 7).
A recurring feature of the analysis is the dominance of the main grain and oilseed producing and exporting countries of North and South America in the adoption of conservation tillage practices and associated CO2e emission reduction as well as being the countries where the highest concentration of glyphosate use takes place. These countries account for 65% of global glyphosate use (in terms of active ingredient use), 72% of global CO2e emission reduction associated with conservation tillage practices and 79% of the share of these CO2e emissions reduction attributable to glyphosate use. As discussed in the results section, this dominance of the main grain and oilseed exporting countries of North and South American countries is also closely associated with the widespread adoption of GM HT crops tolerant to glyphosate.
In the first 20 years of the widespread use of this technology, tolerance to glyphosate was the dominant trait and glyphosate application dominated weed control in these production systems largely because of its broad-spectrum post-emergence activity, ease of use and cost effectiveness. Often it was used as the sole method of weed control in the first few years of GM HT crop adoption. For example, glyphosate accounted for over 80% of total active ingredient use on GM HT soybean crops in the USA in the late 1990s/early 2000s (Brookes, 2022bCitation73). As discussed earlier, GM HT (tolerant to glyphosate) technology also played a major role facilitating farmers adopting and staying in NT/RT-based conservation tillage production systems during this period.
This approach to weed control contributed to the evolution of weed populations predominated by resistant individual weeds and to weed shifts toward those weed species that are inherently not well controlled by glyphosate (Vencil et al., 2012Citation74, Norsworthy et al., 2012Citation75).
As a result, over the last 20 years, growers of GM HT crops have been using other herbicides (with different and complementary modes of action) in combination with glyphosate and in some cases adopting cultural practices (e.g., reverting to plowing) in more integrated weed management systems. In addition, GM HT crops tolerant to other herbicides (often stacked with glyphosate) have also become available from 2016 (notably to dicamba, 2 4 D and glufosinate). This has likely reduced the year-on-year absolute levels of CO2e emission reductions from NT/RT-based conservation tillage agriculture facilitated by GM HT crops relative to several years ago in North and South America (see for example Lu et al. (2022)Citation76, Van Deynze et al. (2021)Citation77). The estimates presented in this paper do, however, take this factor of influence into account by using the latest available data on the adoption of conservation tillage areas, the share of glyphosate use in the pre plant/burndown phase of crop production cycles and on the share of GM HT crops that are only tolerant to glyphosate as distinct from GM HT crops tolerant to glyphosate plus other herbicides.
Sensitivity Analysis and Caveats to Analysis
Applying sensitivity analysis to the total emission assumption for the manufacture and distribution of glyphosate so that for example it was increased by an illustrative 20% to 13.44 kg of CO2e per kg of glyphosate active ingredient (to factor in the emissions associated with formulation of products containing glyphosate),Footnotec the total amount of annual CO2e emissions associated with the annual manufacture and distribution of glyphosate used in global agriculture would be 10.07 billion kg.
Applying sensitivity analysis to the calculations relating to the annual emissions associated with the farm level application of glyphosate shows that if the CO2e emissions are calculated around the main range of fuel used to apply herbicides around the world (0.5 to 1 liter of fuel per spray ha), the total amount of annual CO2e emissions associated with the application of glyphosate used in global agriculture is within the range of 0.82 billion kg and 1.63 billion kg. Combining the two elements of CO2e emissions associated with the manufacture, production and distribution of glyphosate with farm level application of products containing glyphosate, the total annual CO2e emissions is 9.76 billion kg, within a range of 9.21 billion kg and 11.7 billion kg.
Applying sensitivity analysis to the calculations of the amount of CO2e storage in the form of soil carbon arising from the use of conservation tillage practices facilitated by glyphosate is complicated by the many different factors of influence on soil carbon storage with conservation tillage practices. These include:
- The extent to which the hypothesis that soil organic carbon levels may peak after 20 years and then decline is applied to some areas reported to be using conservation tillage. However, this hypothesis is not widely accepted with other researchers such as Ussiri and Lal (2009Citation34 arguing that very old soils continue to store carbon;
- What assumptions are made about how long the area (total or parts) of conservation tillage used to calculate the annual CO2e storage as soil carbon are assumed to have remained in permanent conservation tillage. A lack of comprehensive location-specific data makes this difficult to explore further although some analysis points to a range of 20% (Claassen R et al., 2018Citation78 relating to the US combined area of corn, cotton, soybeans and wheat 2012-2016) and 90% (Argentine No-Till Farmers Association (AAPRESID)) cited in Brookes, 2022cCitation79 relating to the main soybean, corn and wheat growing area in Argentina;
- The extent to which the use of NT/RT-based production conservation tillage systems also incorporate cover crops and operate crop rotation. There is also a lack of detailed data on these subjects. The only source identified in this research was CEAPCitation42 relating to the USA, which estimated that in the 2013-2016 period there were 24.4 million hectares of arable land and 41.7 million ha in continuous NT (the area used for the USA in this analysis).
In addition, there is scope for applying sensitivity analysis to the assumed share of total CO2e stored as soil carbon with conservation tillage that is attributable to glyphosate depending on the criteria chosen. In this analysis, the share of the total herbicide spray area accounted for by glyphosate in the key phases of production (seed soil-bed preparation phase and pre-emergence) for the main crops in which conservation tillage is typically practiced was used.
This analysis has utilized several simplifying assumptions to calculate estimates of impact. The author also considers that the assumptions applied to the attributed share of glyphosate to conservation tillage-related CO2e emission/removals have been conservative. The research estimated that worldwide use of glyphosate annually contributes to a significant net CO2e emission reduction/removal through its facilitating role in the adoption and maintenance of NT/RT-based conservation tillage, which equates to the equivalent of nearly 31% of the total annual global conservation tillage-related CO2e emission savings/removals. Even if more conservative assumptions than those used in this study were applied, the share of the total annual global conservation tillage-related CO2e emission savings/removals attributed to glyphosate needs only be between 5.4% and 7.1% of these removals to cancel out the annual CO2e emissions associated with the manufacture, distribution and use of glyphosate.
Overall, there are many variables and different factors influencing each of these variables that could be included in analysis. To fully incorporate all possible variables that might simultaneously impact on soil carbon storage levels in crops grown using conservation tillage practices around the world (or even in a limited range of countries in North and South America) is likely to require a considerable input of resource and expertise across more than one discipline. It will also have considerable data requirements if more sophisticated analysis, such as building regional or farm level greenhouse gas emission calculator models were to be included. Some of this data is also unlikely to be available (e.g., comprehensive data on the area of remaining in conservation tillage in each country each year) and will therefore require the continued use of some simplifying assumptions.
All these factors should be taken into consideration if more sophisticated and complex analysis is to be undertaken beyond the findings of this work.
Terminology
In the analysis and quantification of greenhouse gas (GHG) emissions associated with the production and use of inputs in agricultural production systems, GHG emissions may arise from the emission of several gases, of which the most common are carbon dioxide (CO2), methane (CH4) and nitrous oxide (N2O). As a specific unit of each gas (e.g., 1 kg) is not equivalent in terms of its greenhouse gas emission, comparisons are usually referred to in carbon dioxide equivalents (CO2e), with conversions into CO2e of a particular gas made using what is known as the global warming potential (GWP) of each gas. For example, the GWP of methane (CH4) is 27.9 meaning that 1 kg of methane emitted is the equivalent of 27.9 kg of carbon dioxide. In this paper, all references to carbon dioxide emissions are in terms of carbon dioxide equivalence (CO2e).
Graham Brookes is an agricultural economist with PG Economics, UK. He has more than 30 years’ experience in analyzing the impact of technology use and policy change in agriculture and has authored many papers in peer-reviewed journals on the impact of regulation, policy change, and GM crop technology.
This is an excerpt of a study originally posted at GM Crops & Food – Biotechnology in Agriculture and the Food Chain and is reposted here under fair use guidelines. Any reposting should credit the original study. Find GM Crops & Food on X @GMCrops